Czech vs Spanish American GED/Equivalency
COMPARE
Czech
Spanish American
GED/Equivalency
GED/Equivalency Comparison
Czechs
Spanish Americans
88.1%
GED/EQUIVALENCY
99.5/ 100
METRIC RATING
45th/ 347
METRIC RANK
83.6%
GED/EQUIVALENCY
0.8/ 100
METRIC RATING
251st/ 347
METRIC RANK
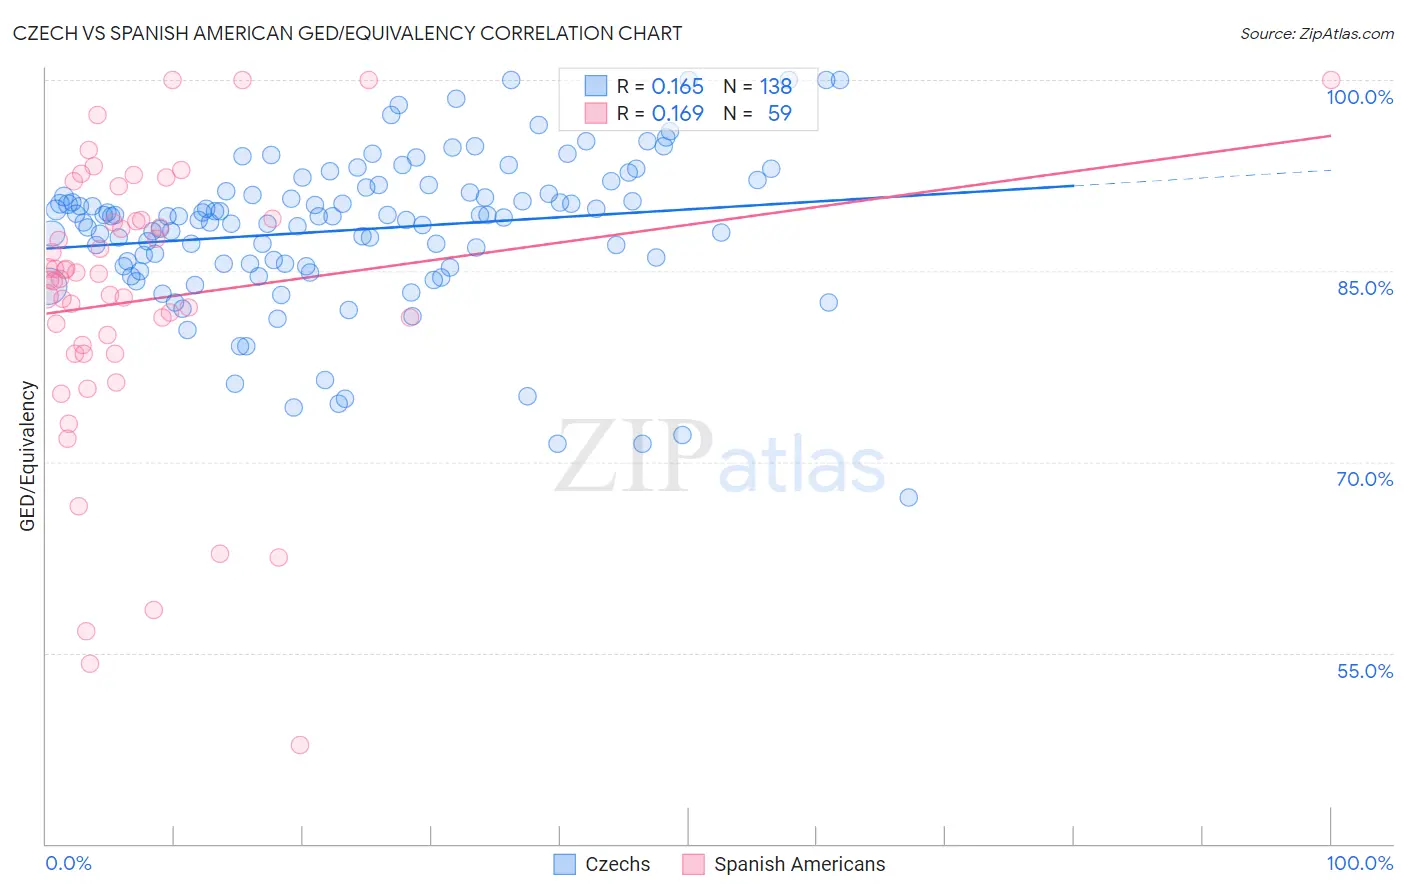
Czech vs Spanish American GED/Equivalency Correlation Chart
The statistical analysis conducted on geographies consisting of 484,813,898 people shows a poor positive correlation between the proportion of Czechs and percentage of population with at least ged/equivalency education in the United States with a correlation coefficient (R) of 0.165 and weighted average of 88.1%. Similarly, the statistical analysis conducted on geographies consisting of 103,168,542 people shows a poor positive correlation between the proportion of Spanish Americans and percentage of population with at least ged/equivalency education in the United States with a correlation coefficient (R) of 0.169 and weighted average of 83.6%, a difference of 5.3%.
GED/Equivalency Correlation Summary
| Measurement | Czech | Spanish American |
| Minimum | 67.2% | 47.7% |
| Maximum | 100.0% | 100.0% |
| Range | 32.8% | 52.3% |
| Mean | 88.2% | 82.7% |
| Median | 89.3% | 84.3% |
| Interquartile 25% (IQ1) | 85.5% | 78.5% |
| Interquartile 75% (IQ3) | 91.2% | 89.0% |
| Interquartile Range (IQR) | 5.7% | 10.5% |
| Standard Deviation (Sample) | 6.0% | 11.3% |
| Standard Deviation (Population) | 6.0% | 11.2% |
Similar Demographics by GED/Equivalency
Demographics Similar to Czechs by GED/Equivalency
In terms of ged/equivalency, the demographic groups most similar to Czechs are Immigrants from Switzerland (88.1%, a difference of 0.020%), Immigrants from Latvia (88.1%, a difference of 0.030%), Greek (88.1%, a difference of 0.030%), Macedonian (88.1%, a difference of 0.040%), and Australian (88.1%, a difference of 0.040%).
| Demographics | Rating | Rank | GED/Equivalency |
| Burmese | 99.7 /100 | #38 | Exceptional 88.3% |
| Immigrants | Israel | 99.6 /100 | #39 | Exceptional 88.2% |
| Italians | 99.6 /100 | #40 | Exceptional 88.2% |
| Finns | 99.6 /100 | #41 | Exceptional 88.2% |
| Cambodians | 99.6 /100 | #42 | Exceptional 88.2% |
| Immigrants | Scotland | 99.6 /100 | #43 | Exceptional 88.2% |
| Macedonians | 99.5 /100 | #44 | Exceptional 88.1% |
| Czechs | 99.5 /100 | #45 | Exceptional 88.1% |
| Immigrants | Switzerland | 99.5 /100 | #46 | Exceptional 88.1% |
| Immigrants | Latvia | 99.5 /100 | #47 | Exceptional 88.1% |
| Greeks | 99.5 /100 | #48 | Exceptional 88.1% |
| Australians | 99.5 /100 | #49 | Exceptional 88.1% |
| Immigrants | Korea | 99.5 /100 | #50 | Exceptional 88.1% |
| Immigrants | Netherlands | 99.4 /100 | #51 | Exceptional 88.0% |
| Zimbabweans | 99.4 /100 | #52 | Exceptional 88.0% |
Demographics Similar to Spanish Americans by GED/Equivalency
In terms of ged/equivalency, the demographic groups most similar to Spanish Americans are Bahamian (83.6%, a difference of 0.0%), Comanche (83.6%, a difference of 0.060%), Creek (83.6%, a difference of 0.090%), Shoshone (83.7%, a difference of 0.15%), and Crow (83.8%, a difference of 0.16%).
| Demographics | Rating | Rank | GED/Equivalency |
| Immigrants | Ghana | 1.3 /100 | #244 | Tragic 83.9% |
| Immigrants | Senegal | 1.2 /100 | #245 | Tragic 83.8% |
| Chickasaw | 1.2 /100 | #246 | Tragic 83.8% |
| Immigrants | Western Africa | 1.1 /100 | #247 | Tragic 83.8% |
| Blackfeet | 1.1 /100 | #248 | Tragic 83.8% |
| Crow | 1.1 /100 | #249 | Tragic 83.8% |
| Shoshone | 1.0 /100 | #250 | Tragic 83.7% |
| Spanish Americans | 0.8 /100 | #251 | Tragic 83.6% |
| Bahamians | 0.8 /100 | #252 | Tragic 83.6% |
| Comanche | 0.7 /100 | #253 | Tragic 83.6% |
| Creek | 0.7 /100 | #254 | Tragic 83.6% |
| Colville | 0.5 /100 | #255 | Tragic 83.4% |
| Africans | 0.5 /100 | #256 | Tragic 83.4% |
| Jamaicans | 0.4 /100 | #257 | Tragic 83.3% |
| Malaysians | 0.4 /100 | #258 | Tragic 83.3% |