Cuban vs Okinawan 6th Grade
COMPARE
Cuban
Okinawan
6th Grade
6th Grade Comparison
Cubans
Okinawans
96.2%
6TH GRADE
0.1/ 100
METRIC RATING
283rd/ 347
METRIC RANK
97.4%
6TH GRADE
94.2/ 100
METRIC RATING
124th/ 347
METRIC RANK
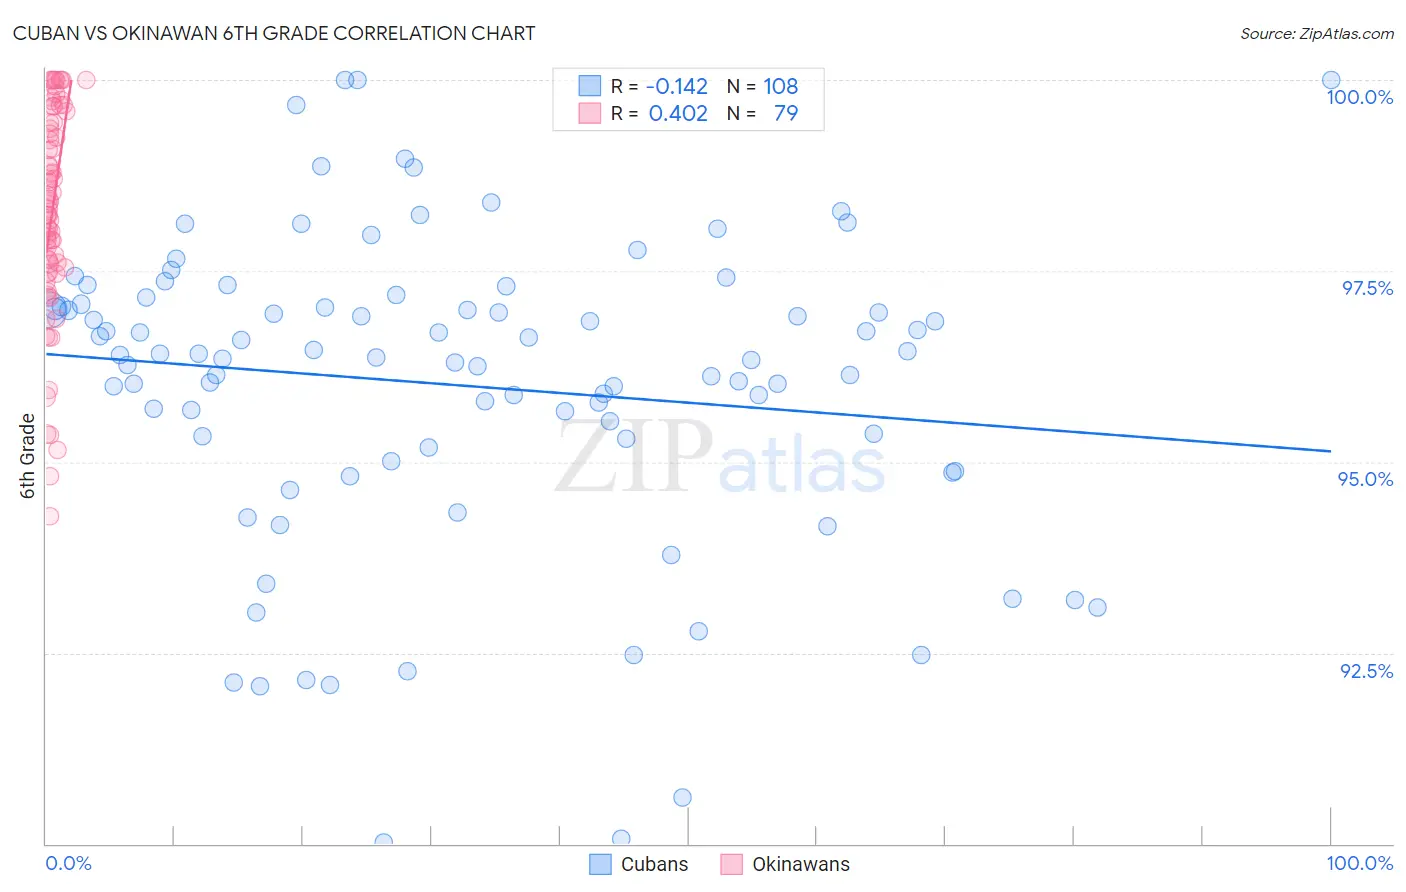
Cuban vs Okinawan 6th Grade Correlation Chart
The statistical analysis conducted on geographies consisting of 449,326,865 people shows a poor negative correlation between the proportion of Cubans and percentage of population with at least 6th grade education in the United States with a correlation coefficient (R) of -0.142 and weighted average of 96.2%. Similarly, the statistical analysis conducted on geographies consisting of 73,779,368 people shows a moderate positive correlation between the proportion of Okinawans and percentage of population with at least 6th grade education in the United States with a correlation coefficient (R) of 0.402 and weighted average of 97.4%, a difference of 1.2%.
6th Grade Correlation Summary
| Measurement | Cuban | Okinawan |
| Minimum | 90.0% | 94.3% |
| Maximum | 100.0% | 100.0% |
| Range | 10.0% | 5.7% |
| Mean | 96.0% | 98.3% |
| Median | 96.4% | 98.3% |
| Interquartile 25% (IQ1) | 95.2% | 97.5% |
| Interquartile 75% (IQ3) | 97.0% | 99.4% |
| Interquartile Range (IQR) | 1.8% | 2.0% |
| Standard Deviation (Sample) | 2.0% | 1.4% |
| Standard Deviation (Population) | 2.0% | 1.4% |
Similar Demographics by 6th Grade
Demographics Similar to Cubans by 6th Grade
In terms of 6th grade, the demographic groups most similar to Cubans are Trinidadian and Tobagonian (96.2%, a difference of 0.010%), Houma (96.2%, a difference of 0.010%), Fijian (96.2%, a difference of 0.010%), Immigrants from Peru (96.2%, a difference of 0.020%), and Immigrants from Afghanistan (96.2%, a difference of 0.020%).
| Demographics | Rating | Rank | 6th Grade |
| Yaqui | 0.1 /100 | #276 | Tragic 96.3% |
| Immigrants | Western Africa | 0.1 /100 | #277 | Tragic 96.3% |
| Immigrants | Thailand | 0.1 /100 | #278 | Tragic 96.3% |
| Immigrants | Peru | 0.1 /100 | #279 | Tragic 96.2% |
| Immigrants | Afghanistan | 0.1 /100 | #280 | Tragic 96.2% |
| Trinidadians and Tobagonians | 0.1 /100 | #281 | Tragic 96.2% |
| Houma | 0.1 /100 | #282 | Tragic 96.2% |
| Cubans | 0.1 /100 | #283 | Tragic 96.2% |
| Fijians | 0.1 /100 | #284 | Tragic 96.2% |
| Somalis | 0.1 /100 | #285 | Tragic 96.2% |
| Barbadians | 0.0 /100 | #286 | Tragic 96.2% |
| Immigrants | Trinidad and Tobago | 0.0 /100 | #287 | Tragic 96.2% |
| Malaysians | 0.0 /100 | #288 | Tragic 96.2% |
| Immigrants | Eritrea | 0.0 /100 | #289 | Tragic 96.1% |
| Immigrants | Somalia | 0.0 /100 | #290 | Tragic 96.1% |
Demographics Similar to Okinawans by 6th Grade
In terms of 6th grade, the demographic groups most similar to Okinawans are Hmong (97.4%, a difference of 0.0%), Syrian (97.4%, a difference of 0.010%), Immigrants from Norway (97.4%, a difference of 0.010%), Immigrants from France (97.4%, a difference of 0.010%), and Spanish (97.3%, a difference of 0.010%).
| Demographics | Rating | Rank | 6th Grade |
| Basques | 95.4 /100 | #117 | Exceptional 97.4% |
| Immigrants | Japan | 95.2 /100 | #118 | Exceptional 97.4% |
| Immigrants | Zimbabwe | 95.0 /100 | #119 | Exceptional 97.4% |
| Syrians | 94.8 /100 | #120 | Exceptional 97.4% |
| Immigrants | Norway | 94.7 /100 | #121 | Exceptional 97.4% |
| Immigrants | France | 94.5 /100 | #122 | Exceptional 97.4% |
| Hmong | 94.4 /100 | #123 | Exceptional 97.4% |
| Okinawans | 94.2 /100 | #124 | Exceptional 97.4% |
| Spanish | 93.7 /100 | #125 | Exceptional 97.3% |
| Immigrants | Bulgaria | 93.6 /100 | #126 | Exceptional 97.3% |
| Immigrants | Croatia | 93.1 /100 | #127 | Exceptional 97.3% |
| Immigrants | Romania | 92.0 /100 | #128 | Exceptional 97.3% |
| Immigrants | Serbia | 91.9 /100 | #129 | Exceptional 97.3% |
| Cambodians | 91.8 /100 | #130 | Exceptional 97.3% |
| Immigrants | Europe | 91.1 /100 | #131 | Exceptional 97.3% |