Subsaharan African vs Immigrants from West Indies 6th Grade
COMPARE
Subsaharan African
Immigrants from West Indies
6th Grade
6th Grade Comparison
Sub-Saharan Africans
Immigrants from West Indies
96.7%
6TH GRADE
3.5/ 100
METRIC RATING
231st/ 347
METRIC RANK
96.1%
6TH GRADE
0.0/ 100
METRIC RATING
293rd/ 347
METRIC RANK
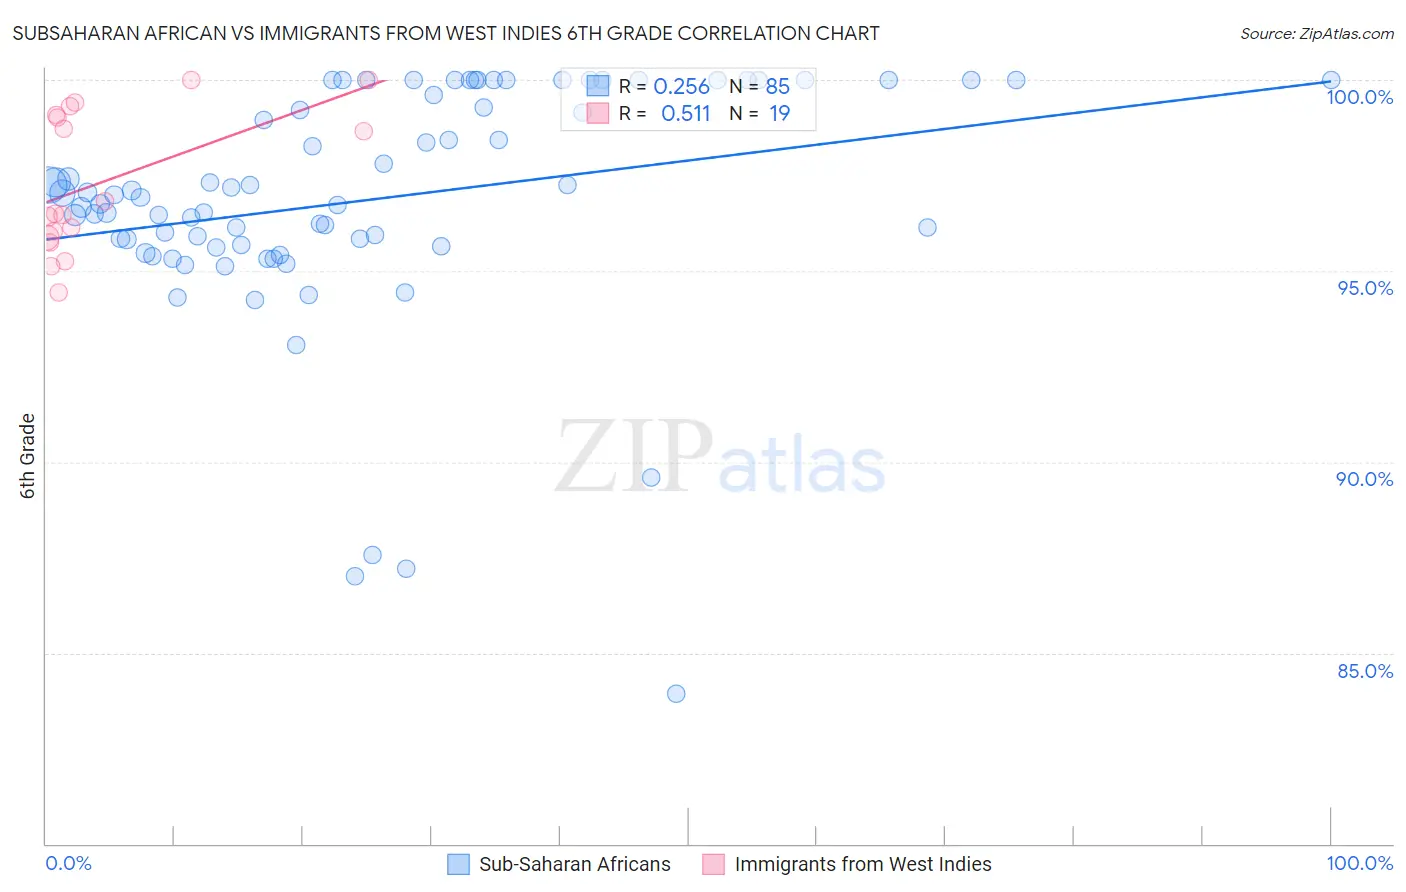
Subsaharan African vs Immigrants from West Indies 6th Grade Correlation Chart
The statistical analysis conducted on geographies consisting of 508,219,094 people shows a weak positive correlation between the proportion of Sub-Saharan Africans and percentage of population with at least 6th grade education in the United States with a correlation coefficient (R) of 0.256 and weighted average of 96.7%. Similarly, the statistical analysis conducted on geographies consisting of 72,457,514 people shows a substantial positive correlation between the proportion of Immigrants from West Indies and percentage of population with at least 6th grade education in the United States with a correlation coefficient (R) of 0.511 and weighted average of 96.1%, a difference of 0.64%.
6th Grade Correlation Summary
| Measurement | Subsaharan African | Immigrants from West Indies |
| Minimum | 83.9% | 94.4% |
| Maximum | 100.0% | 100.0% |
| Range | 16.1% | 5.6% |
| Mean | 96.9% | 97.3% |
| Median | 97.0% | 96.5% |
| Interquartile 25% (IQ1) | 95.7% | 95.9% |
| Interquartile 75% (IQ3) | 100.0% | 99.1% |
| Interquartile Range (IQR) | 4.3% | 3.2% |
| Standard Deviation (Sample) | 3.1% | 1.8% |
| Standard Deviation (Population) | 3.1% | 1.8% |
Similar Demographics by 6th Grade
Demographics Similar to Sub-Saharan Africans by 6th Grade
In terms of 6th grade, the demographic groups most similar to Sub-Saharan Africans are South American Indian (96.7%, a difference of 0.0%), Immigrants from Eastern Asia (96.7%, a difference of 0.010%), Yuman (96.7%, a difference of 0.010%), Immigrants from Panama (96.7%, a difference of 0.020%), and Immigrants from Western Asia (96.7%, a difference of 0.020%).
| Demographics | Rating | Rank | 6th Grade |
| Immigrants | Southern Europe | 4.4 /100 | #224 | Tragic 96.7% |
| Immigrants | Pakistan | 4.4 /100 | #225 | Tragic 96.7% |
| Immigrants | Panama | 4.2 /100 | #226 | Tragic 96.7% |
| Immigrants | Western Asia | 4.1 /100 | #227 | Tragic 96.7% |
| Immigrants | Malaysia | 4.0 /100 | #228 | Tragic 96.7% |
| Assyrians/Chaldeans/Syriacs | 4.0 /100 | #229 | Tragic 96.7% |
| Immigrants | Eastern Asia | 4.0 /100 | #230 | Tragic 96.7% |
| Sub-Saharan Africans | 3.5 /100 | #231 | Tragic 96.7% |
| South American Indians | 3.5 /100 | #232 | Tragic 96.7% |
| Yuman | 3.2 /100 | #233 | Tragic 96.7% |
| Uruguayans | 2.5 /100 | #234 | Tragic 96.6% |
| Asians | 2.4 /100 | #235 | Tragic 96.6% |
| Immigrants | Indonesia | 2.3 /100 | #236 | Tragic 96.6% |
| Immigrants | Eastern Africa | 2.0 /100 | #237 | Tragic 96.6% |
| Nigerians | 1.9 /100 | #238 | Tragic 96.6% |
Demographics Similar to Immigrants from West Indies by 6th Grade
In terms of 6th grade, the demographic groups most similar to Immigrants from West Indies are Immigrants from Barbados (96.1%, a difference of 0.040%), Immigrants from Somalia (96.1%, a difference of 0.060%), Immigrants from St. Vincent and the Grenadines (96.1%, a difference of 0.060%), British West Indian (96.0%, a difference of 0.070%), and Immigrants from Eritrea (96.1%, a difference of 0.080%).
| Demographics | Rating | Rank | 6th Grade |
| Barbadians | 0.0 /100 | #286 | Tragic 96.2% |
| Immigrants | Trinidad and Tobago | 0.0 /100 | #287 | Tragic 96.2% |
| Malaysians | 0.0 /100 | #288 | Tragic 96.2% |
| Immigrants | Eritrea | 0.0 /100 | #289 | Tragic 96.1% |
| Immigrants | Somalia | 0.0 /100 | #290 | Tragic 96.1% |
| Immigrants | St. Vincent and the Grenadines | 0.0 /100 | #291 | Tragic 96.1% |
| Immigrants | Barbados | 0.0 /100 | #292 | Tragic 96.1% |
| Immigrants | West Indies | 0.0 /100 | #293 | Tragic 96.1% |
| British West Indians | 0.0 /100 | #294 | Tragic 96.0% |
| Immigrants | Grenada | 0.0 /100 | #295 | Tragic 95.9% |
| Immigrants | South Eastern Asia | 0.0 /100 | #296 | Tragic 95.9% |
| Haitians | 0.0 /100 | #297 | Tragic 95.8% |
| Sri Lankans | 0.0 /100 | #298 | Tragic 95.8% |
| Immigrants | Laos | 0.0 /100 | #299 | Tragic 95.7% |
| Immigrants | Dominica | 0.0 /100 | #300 | Tragic 95.7% |