Cuban vs Asian 6th Grade
COMPARE
Cuban
Asian
6th Grade
6th Grade Comparison
Cubans
Asians
96.2%
6TH GRADE
0.1/ 100
METRIC RATING
283rd/ 347
METRIC RANK
96.6%
6TH GRADE
2.4/ 100
METRIC RATING
235th/ 347
METRIC RANK
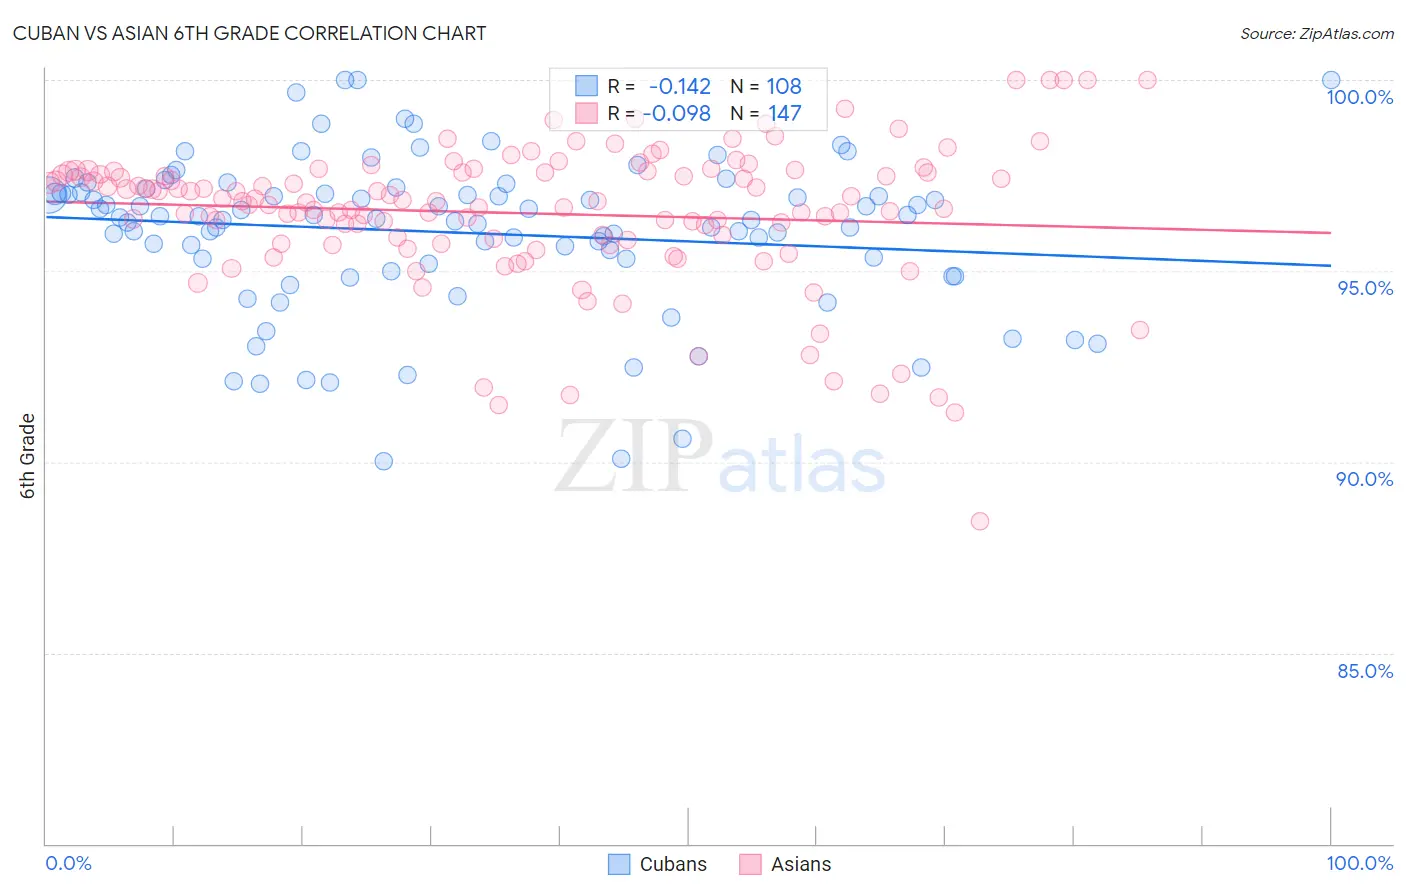
Cuban vs Asian 6th Grade Correlation Chart
The statistical analysis conducted on geographies consisting of 449,326,865 people shows a poor negative correlation between the proportion of Cubans and percentage of population with at least 6th grade education in the United States with a correlation coefficient (R) of -0.142 and weighted average of 96.2%. Similarly, the statistical analysis conducted on geographies consisting of 550,801,467 people shows a slight negative correlation between the proportion of Asians and percentage of population with at least 6th grade education in the United States with a correlation coefficient (R) of -0.098 and weighted average of 96.6%, a difference of 0.43%.
6th Grade Correlation Summary
| Measurement | Cuban | Asian |
| Minimum | 90.0% | 88.5% |
| Maximum | 100.0% | 100.0% |
| Range | 10.0% | 11.5% |
| Mean | 96.0% | 96.5% |
| Median | 96.4% | 96.8% |
| Interquartile 25% (IQ1) | 95.2% | 95.8% |
| Interquartile 75% (IQ3) | 97.0% | 97.6% |
| Interquartile Range (IQR) | 1.8% | 1.8% |
| Standard Deviation (Sample) | 2.0% | 1.9% |
| Standard Deviation (Population) | 2.0% | 1.9% |
Similar Demographics by 6th Grade
Demographics Similar to Cubans by 6th Grade
In terms of 6th grade, the demographic groups most similar to Cubans are Trinidadian and Tobagonian (96.2%, a difference of 0.010%), Houma (96.2%, a difference of 0.010%), Fijian (96.2%, a difference of 0.010%), Immigrants from Peru (96.2%, a difference of 0.020%), and Immigrants from Afghanistan (96.2%, a difference of 0.020%).
| Demographics | Rating | Rank | 6th Grade |
| Yaqui | 0.1 /100 | #276 | Tragic 96.3% |
| Immigrants | Western Africa | 0.1 /100 | #277 | Tragic 96.3% |
| Immigrants | Thailand | 0.1 /100 | #278 | Tragic 96.3% |
| Immigrants | Peru | 0.1 /100 | #279 | Tragic 96.2% |
| Immigrants | Afghanistan | 0.1 /100 | #280 | Tragic 96.2% |
| Trinidadians and Tobagonians | 0.1 /100 | #281 | Tragic 96.2% |
| Houma | 0.1 /100 | #282 | Tragic 96.2% |
| Cubans | 0.1 /100 | #283 | Tragic 96.2% |
| Fijians | 0.1 /100 | #284 | Tragic 96.2% |
| Somalis | 0.1 /100 | #285 | Tragic 96.2% |
| Barbadians | 0.0 /100 | #286 | Tragic 96.2% |
| Immigrants | Trinidad and Tobago | 0.0 /100 | #287 | Tragic 96.2% |
| Malaysians | 0.0 /100 | #288 | Tragic 96.2% |
| Immigrants | Eritrea | 0.0 /100 | #289 | Tragic 96.1% |
| Immigrants | Somalia | 0.0 /100 | #290 | Tragic 96.1% |
Demographics Similar to Asians by 6th Grade
In terms of 6th grade, the demographic groups most similar to Asians are Uruguayan (96.6%, a difference of 0.0%), Immigrants from Indonesia (96.6%, a difference of 0.010%), Immigrants from Eastern Africa (96.6%, a difference of 0.020%), Yuman (96.7%, a difference of 0.030%), and Nigerian (96.6%, a difference of 0.030%).
| Demographics | Rating | Rank | 6th Grade |
| Immigrants | Malaysia | 4.0 /100 | #228 | Tragic 96.7% |
| Assyrians/Chaldeans/Syriacs | 4.0 /100 | #229 | Tragic 96.7% |
| Immigrants | Eastern Asia | 4.0 /100 | #230 | Tragic 96.7% |
| Sub-Saharan Africans | 3.5 /100 | #231 | Tragic 96.7% |
| South American Indians | 3.5 /100 | #232 | Tragic 96.7% |
| Yuman | 3.2 /100 | #233 | Tragic 96.7% |
| Uruguayans | 2.5 /100 | #234 | Tragic 96.6% |
| Asians | 2.4 /100 | #235 | Tragic 96.6% |
| Immigrants | Indonesia | 2.3 /100 | #236 | Tragic 96.6% |
| Immigrants | Eastern Africa | 2.0 /100 | #237 | Tragic 96.6% |
| Nigerians | 1.9 /100 | #238 | Tragic 96.6% |
| Indians (Asian) | 1.9 /100 | #239 | Tragic 96.6% |
| Koreans | 1.9 /100 | #240 | Tragic 96.6% |
| Senegalese | 1.8 /100 | #241 | Tragic 96.6% |
| Immigrants | Asia | 1.8 /100 | #242 | Tragic 96.6% |