Cuban vs Colombian 6th Grade
COMPARE
Cuban
Colombian
6th Grade
6th Grade Comparison
Cubans
Colombians
96.2%
6TH GRADE
0.1/ 100
METRIC RATING
283rd/ 347
METRIC RANK
96.5%
6TH GRADE
0.9/ 100
METRIC RATING
249th/ 347
METRIC RANK
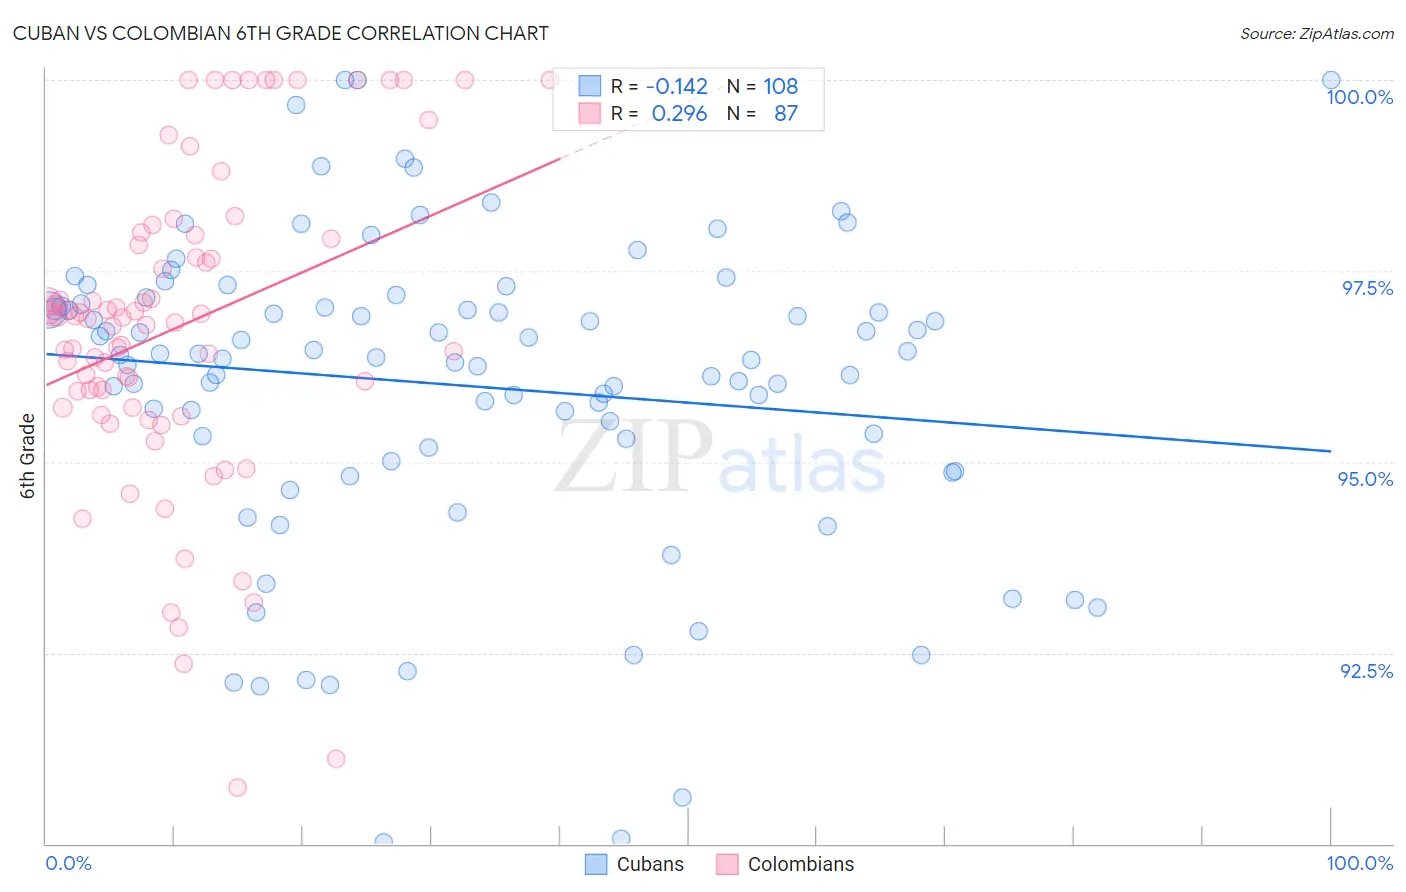
Cuban vs Colombian 6th Grade Correlation Chart
The statistical analysis conducted on geographies consisting of 449,326,865 people shows a poor negative correlation between the proportion of Cubans and percentage of population with at least 6th grade education in the United States with a correlation coefficient (R) of -0.142 and weighted average of 96.2%. Similarly, the statistical analysis conducted on geographies consisting of 419,655,116 people shows a weak positive correlation between the proportion of Colombians and percentage of population with at least 6th grade education in the United States with a correlation coefficient (R) of 0.296 and weighted average of 96.5%, a difference of 0.32%.
6th Grade Correlation Summary
| Measurement | Cuban | Colombian |
| Minimum | 90.0% | 90.7% |
| Maximum | 100.0% | 100.0% |
| Range | 10.0% | 9.3% |
| Mean | 96.0% | 96.8% |
| Median | 96.4% | 96.9% |
| Interquartile 25% (IQ1) | 95.2% | 95.7% |
| Interquartile 75% (IQ3) | 97.0% | 97.9% |
| Interquartile Range (IQR) | 1.8% | 2.2% |
| Standard Deviation (Sample) | 2.0% | 2.0% |
| Standard Deviation (Population) | 2.0% | 2.0% |
Similar Demographics by 6th Grade
Demographics Similar to Cubans by 6th Grade
In terms of 6th grade, the demographic groups most similar to Cubans are Trinidadian and Tobagonian (96.2%, a difference of 0.010%), Houma (96.2%, a difference of 0.010%), Fijian (96.2%, a difference of 0.010%), Immigrants from Peru (96.2%, a difference of 0.020%), and Immigrants from Afghanistan (96.2%, a difference of 0.020%).
| Demographics | Rating | Rank | 6th Grade |
| Yaqui | 0.1 /100 | #276 | Tragic 96.3% |
| Immigrants | Western Africa | 0.1 /100 | #277 | Tragic 96.3% |
| Immigrants | Thailand | 0.1 /100 | #278 | Tragic 96.3% |
| Immigrants | Peru | 0.1 /100 | #279 | Tragic 96.2% |
| Immigrants | Afghanistan | 0.1 /100 | #280 | Tragic 96.2% |
| Trinidadians and Tobagonians | 0.1 /100 | #281 | Tragic 96.2% |
| Houma | 0.1 /100 | #282 | Tragic 96.2% |
| Cubans | 0.1 /100 | #283 | Tragic 96.2% |
| Fijians | 0.1 /100 | #284 | Tragic 96.2% |
| Somalis | 0.1 /100 | #285 | Tragic 96.2% |
| Barbadians | 0.0 /100 | #286 | Tragic 96.2% |
| Immigrants | Trinidad and Tobago | 0.0 /100 | #287 | Tragic 96.2% |
| Malaysians | 0.0 /100 | #288 | Tragic 96.2% |
| Immigrants | Eritrea | 0.0 /100 | #289 | Tragic 96.1% |
| Immigrants | Somalia | 0.0 /100 | #290 | Tragic 96.1% |
Demographics Similar to Colombians by 6th Grade
In terms of 6th grade, the demographic groups most similar to Colombians are Tohono O'odham (96.5%, a difference of 0.0%), Bolivian (96.5%, a difference of 0.010%), Immigrants from Middle Africa (96.5%, a difference of 0.020%), Immigrants from Costa Rica (96.6%, a difference of 0.040%), and Immigrants from Africa (96.6%, a difference of 0.040%).
| Demographics | Rating | Rank | 6th Grade |
| Immigrants | Asia | 1.8 /100 | #242 | Tragic 96.6% |
| Immigrants | Liberia | 1.6 /100 | #243 | Tragic 96.6% |
| Ethiopians | 1.5 /100 | #244 | Tragic 96.6% |
| Immigrants | Costa Rica | 1.3 /100 | #245 | Tragic 96.6% |
| Immigrants | Africa | 1.3 /100 | #246 | Tragic 96.6% |
| Bolivians | 1.0 /100 | #247 | Tragic 96.5% |
| Tohono O'odham | 1.0 /100 | #248 | Tragic 96.5% |
| Colombians | 0.9 /100 | #249 | Tragic 96.5% |
| Immigrants | Middle Africa | 0.8 /100 | #250 | Tragic 96.5% |
| Immigrants | Senegal | 0.7 /100 | #251 | Tragic 96.5% |
| Immigrants | Uruguay | 0.6 /100 | #252 | Tragic 96.5% |
| Jamaicans | 0.6 /100 | #253 | Tragic 96.5% |
| Immigrants | Ethiopia | 0.6 /100 | #254 | Tragic 96.5% |
| Immigrants | Congo | 0.6 /100 | #255 | Tragic 96.5% |
| U.S. Virgin Islanders | 0.5 /100 | #256 | Tragic 96.5% |