Immigrants from Ghana vs Immigrants from West Indies 6th Grade
COMPARE
Immigrants from Ghana
Immigrants from West Indies
6th Grade
6th Grade Comparison
Immigrants from Ghana
Immigrants from West Indies
96.3%
6TH GRADE
0.1/ 100
METRIC RATING
275th/ 347
METRIC RANK
96.1%
6TH GRADE
0.0/ 100
METRIC RATING
293rd/ 347
METRIC RANK
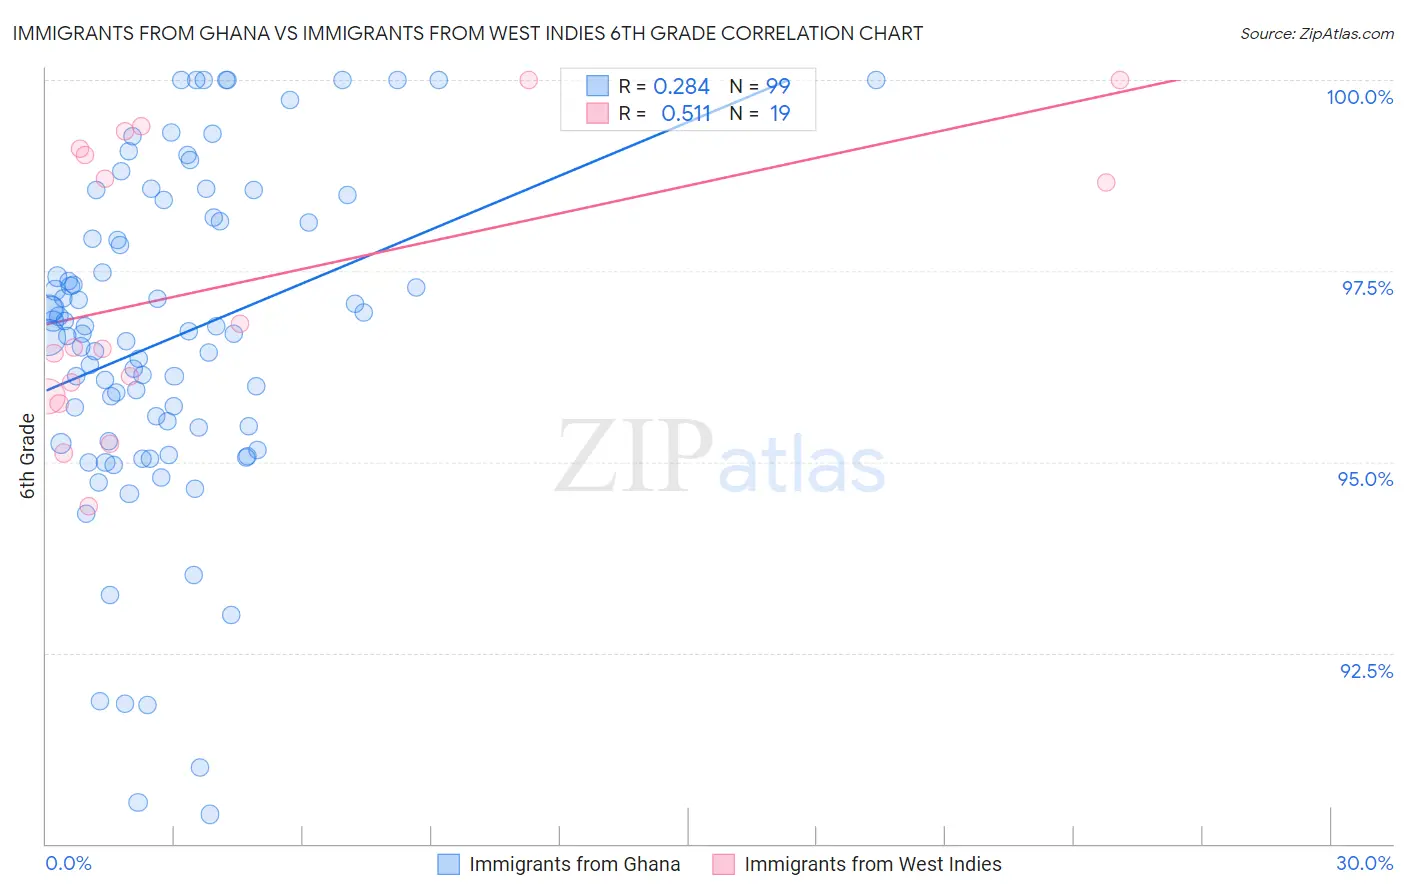
Immigrants from Ghana vs Immigrants from West Indies 6th Grade Correlation Chart
The statistical analysis conducted on geographies consisting of 199,952,023 people shows a weak positive correlation between the proportion of Immigrants from Ghana and percentage of population with at least 6th grade education in the United States with a correlation coefficient (R) of 0.284 and weighted average of 96.3%. Similarly, the statistical analysis conducted on geographies consisting of 72,457,514 people shows a substantial positive correlation between the proportion of Immigrants from West Indies and percentage of population with at least 6th grade education in the United States with a correlation coefficient (R) of 0.511 and weighted average of 96.1%, a difference of 0.22%.
6th Grade Correlation Summary
| Measurement | Immigrants from Ghana | Immigrants from West Indies |
| Minimum | 90.4% | 94.4% |
| Maximum | 100.0% | 100.0% |
| Range | 9.6% | 5.6% |
| Mean | 96.6% | 97.3% |
| Median | 96.7% | 96.5% |
| Interquartile 25% (IQ1) | 95.3% | 95.9% |
| Interquartile 75% (IQ3) | 98.1% | 99.1% |
| Interquartile Range (IQR) | 2.9% | 3.2% |
| Standard Deviation (Sample) | 2.2% | 1.8% |
| Standard Deviation (Population) | 2.2% | 1.8% |
Demographics Similar to Immigrants from Ghana and Immigrants from West Indies by 6th Grade
In terms of 6th grade, the demographic groups most similar to Immigrants from Ghana are Immigrants from Philippines (96.3%, a difference of 0.010%), Yaqui (96.3%, a difference of 0.010%), Immigrants from Western Africa (96.3%, a difference of 0.020%), Immigrants from Thailand (96.3%, a difference of 0.020%), and Immigrants from Peru (96.2%, a difference of 0.030%). Similarly, the demographic groups most similar to Immigrants from West Indies are Immigrants from Barbados (96.1%, a difference of 0.040%), Immigrants from Somalia (96.1%, a difference of 0.060%), Immigrants from St. Vincent and the Grenadines (96.1%, a difference of 0.060%), British West Indian (96.0%, a difference of 0.070%), and Immigrants from Eritrea (96.1%, a difference of 0.080%).
| Demographics | Rating | Rank | 6th Grade |
| Immigrants | Philippines | 0.1 /100 | #274 | Tragic 96.3% |
| Immigrants | Ghana | 0.1 /100 | #275 | Tragic 96.3% |
| Yaqui | 0.1 /100 | #276 | Tragic 96.3% |
| Immigrants | Western Africa | 0.1 /100 | #277 | Tragic 96.3% |
| Immigrants | Thailand | 0.1 /100 | #278 | Tragic 96.3% |
| Immigrants | Peru | 0.1 /100 | #279 | Tragic 96.2% |
| Immigrants | Afghanistan | 0.1 /100 | #280 | Tragic 96.2% |
| Trinidadians and Tobagonians | 0.1 /100 | #281 | Tragic 96.2% |
| Houma | 0.1 /100 | #282 | Tragic 96.2% |
| Cubans | 0.1 /100 | #283 | Tragic 96.2% |
| Fijians | 0.1 /100 | #284 | Tragic 96.2% |
| Somalis | 0.1 /100 | #285 | Tragic 96.2% |
| Barbadians | 0.0 /100 | #286 | Tragic 96.2% |
| Immigrants | Trinidad and Tobago | 0.0 /100 | #287 | Tragic 96.2% |
| Malaysians | 0.0 /100 | #288 | Tragic 96.2% |
| Immigrants | Eritrea | 0.0 /100 | #289 | Tragic 96.1% |
| Immigrants | Somalia | 0.0 /100 | #290 | Tragic 96.1% |
| Immigrants | St. Vincent and the Grenadines | 0.0 /100 | #291 | Tragic 96.1% |
| Immigrants | Barbados | 0.0 /100 | #292 | Tragic 96.1% |
| Immigrants | West Indies | 0.0 /100 | #293 | Tragic 96.1% |
| British West Indians | 0.0 /100 | #294 | Tragic 96.0% |