Immigrants from Israel vs Trinidadian and Tobagonian Master's Degree
COMPARE
Immigrants from Israel
Trinidadian and Tobagonian
Master's Degree
Master's Degree Comparison
Immigrants from Israel
Trinidadians and Tobagonians
22.6%
MASTER'S DEGREE
100.0/ 100
METRIC RATING
3rd/ 347
METRIC RANK
14.4%
MASTER'S DEGREE
23.5/ 100
METRIC RATING
205th/ 347
METRIC RANK
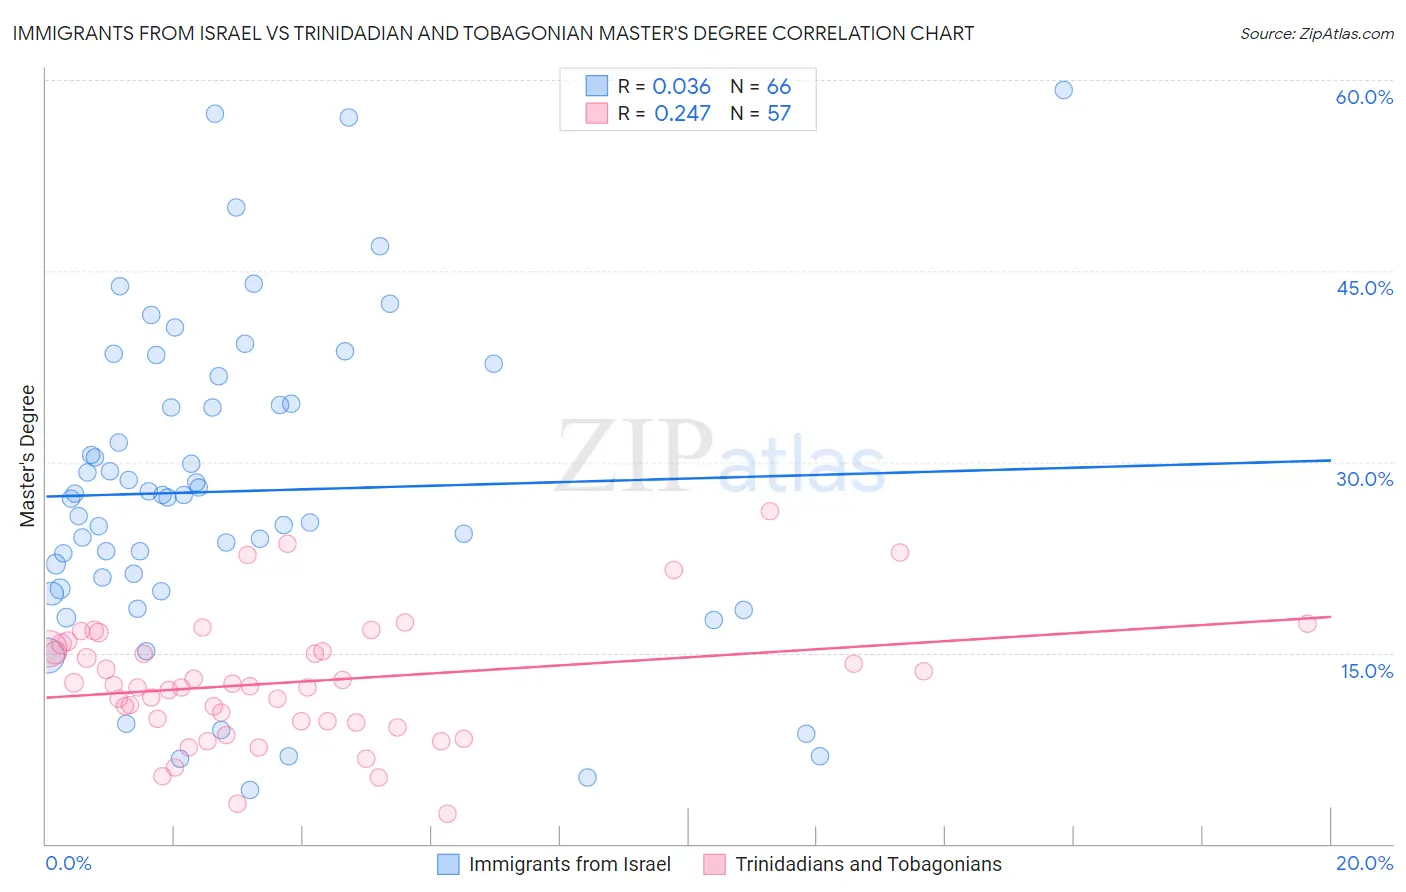
Immigrants from Israel vs Trinidadian and Tobagonian Master's Degree Correlation Chart
The statistical analysis conducted on geographies consisting of 210,015,600 people shows no correlation between the proportion of Immigrants from Israel and percentage of population with at least master's degree education in the United States with a correlation coefficient (R) of 0.036 and weighted average of 22.6%. Similarly, the statistical analysis conducted on geographies consisting of 219,795,372 people shows a weak positive correlation between the proportion of Trinidadians and Tobagonians and percentage of population with at least master's degree education in the United States with a correlation coefficient (R) of 0.247 and weighted average of 14.4%, a difference of 57.7%.
Master's Degree Correlation Summary
| Measurement | Immigrants from Israel | Trinidadian and Tobagonian |
| Minimum | 4.2% | 2.3% |
| Maximum | 59.3% | 26.1% |
| Range | 55.1% | 23.8% |
| Mean | 27.7% | 12.7% |
| Median | 27.3% | 12.3% |
| Interquartile 25% (IQ1) | 20.0% | 9.6% |
| Interquartile 75% (IQ3) | 34.6% | 15.5% |
| Interquartile Range (IQR) | 14.6% | 5.9% |
| Standard Deviation (Sample) | 12.5% | 4.9% |
| Standard Deviation (Population) | 12.4% | 4.9% |
Similar Demographics by Master's Degree
Demographics Similar to Immigrants from Israel by Master's Degree
In terms of master's degree, the demographic groups most similar to Immigrants from Israel are Okinawan (22.6%, a difference of 0.0%), Immigrants from Taiwan (22.5%, a difference of 0.80%), Immigrants from India (22.3%, a difference of 1.5%), Iranian (22.3%, a difference of 1.7%), and Filipino (23.4%, a difference of 3.4%).
| Demographics | Rating | Rank | Master's Degree |
| Immigrants | Singapore | 100.0 /100 | #1 | Exceptional 23.4% |
| Filipinos | 100.0 /100 | #2 | Exceptional 23.4% |
| Immigrants | Israel | 100.0 /100 | #3 | Exceptional 22.6% |
| Okinawans | 100.0 /100 | #4 | Exceptional 22.6% |
| Immigrants | Taiwan | 100.0 /100 | #5 | Exceptional 22.5% |
| Immigrants | India | 100.0 /100 | #6 | Exceptional 22.3% |
| Iranians | 100.0 /100 | #7 | Exceptional 22.3% |
| Cypriots | 100.0 /100 | #8 | Exceptional 21.8% |
| Thais | 100.0 /100 | #9 | Exceptional 21.7% |
| Immigrants | Iran | 100.0 /100 | #10 | Exceptional 21.6% |
| Immigrants | China | 100.0 /100 | #11 | Exceptional 21.2% |
| Eastern Europeans | 100.0 /100 | #12 | Exceptional 21.1% |
| Immigrants | Australia | 100.0 /100 | #13 | Exceptional 20.9% |
| Immigrants | Switzerland | 100.0 /100 | #14 | Exceptional 20.9% |
| Immigrants | Eastern Asia | 100.0 /100 | #15 | Exceptional 20.8% |
Demographics Similar to Trinidadians and Tobagonians by Master's Degree
In terms of master's degree, the demographic groups most similar to Trinidadians and Tobagonians are French (14.4%, a difference of 0.030%), Scandinavian (14.4%, a difference of 0.040%), Yugoslavian (14.4%, a difference of 0.15%), Immigrants from Western Africa (14.4%, a difference of 0.26%), and Scotch-Irish (14.4%, a difference of 0.27%).
| Demographics | Rating | Rank | Master's Degree |
| West Indians | 27.4 /100 | #198 | Fair 14.5% |
| Immigrants | Armenia | 27.2 /100 | #199 | Fair 14.5% |
| Panamanians | 25.1 /100 | #200 | Fair 14.4% |
| Scotch-Irish | 25.0 /100 | #201 | Fair 14.4% |
| Immigrants | Western Africa | 24.9 /100 | #202 | Fair 14.4% |
| Yugoslavians | 24.3 /100 | #203 | Fair 14.4% |
| French | 23.7 /100 | #204 | Fair 14.4% |
| Trinidadians and Tobagonians | 23.5 /100 | #205 | Fair 14.4% |
| Scandinavians | 23.3 /100 | #206 | Fair 14.4% |
| Immigrants | Bosnia and Herzegovina | 22.0 /100 | #207 | Fair 14.3% |
| Immigrants | Barbados | 20.5 /100 | #208 | Fair 14.3% |
| Immigrants | Panama | 20.0 /100 | #209 | Fair 14.3% |
| Sub-Saharan Africans | 19.4 /100 | #210 | Poor 14.2% |
| Somalis | 18.0 /100 | #211 | Poor 14.2% |
| Spanish | 17.8 /100 | #212 | Poor 14.2% |