Argentinean vs Trinidadian and Tobagonian Master's Degree
COMPARE
Argentinean
Trinidadian and Tobagonian
Master's Degree
Master's Degree Comparison
Argentineans
Trinidadians and Tobagonians
18.2%
MASTER'S DEGREE
99.9/ 100
METRIC RATING
62nd/ 347
METRIC RANK
14.4%
MASTER'S DEGREE
23.5/ 100
METRIC RATING
205th/ 347
METRIC RANK
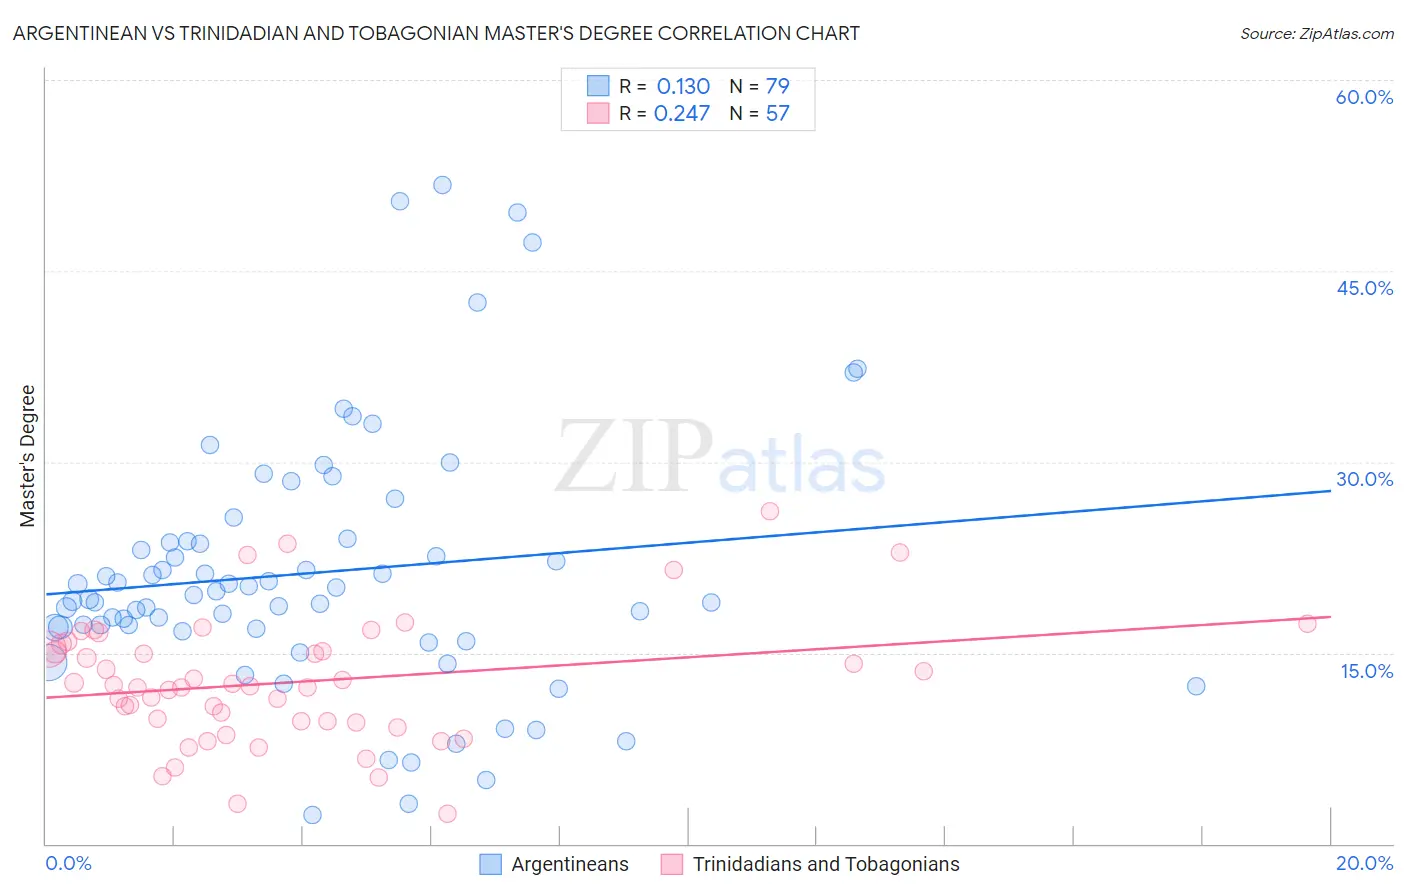
Argentinean vs Trinidadian and Tobagonian Master's Degree Correlation Chart
The statistical analysis conducted on geographies consisting of 297,078,027 people shows a poor positive correlation between the proportion of Argentineans and percentage of population with at least master's degree education in the United States with a correlation coefficient (R) of 0.130 and weighted average of 18.2%. Similarly, the statistical analysis conducted on geographies consisting of 219,795,372 people shows a weak positive correlation between the proportion of Trinidadians and Tobagonians and percentage of population with at least master's degree education in the United States with a correlation coefficient (R) of 0.247 and weighted average of 14.4%, a difference of 26.6%.
Master's Degree Correlation Summary
| Measurement | Argentinean | Trinidadian and Tobagonian |
| Minimum | 2.2% | 2.3% |
| Maximum | 51.7% | 26.1% |
| Range | 49.5% | 23.8% |
| Mean | 21.3% | 12.7% |
| Median | 19.5% | 12.3% |
| Interquartile 25% (IQ1) | 16.9% | 9.6% |
| Interquartile 75% (IQ3) | 23.8% | 15.5% |
| Interquartile Range (IQR) | 6.9% | 5.9% |
| Standard Deviation (Sample) | 10.1% | 4.9% |
| Standard Deviation (Population) | 10.0% | 4.9% |
Similar Demographics by Master's Degree
Demographics Similar to Argentineans by Master's Degree
In terms of master's degree, the demographic groups most similar to Argentineans are Immigrants from Europe (18.2%, a difference of 0.36%), Immigrants from Netherlands (18.1%, a difference of 0.36%), South African (18.1%, a difference of 0.44%), New Zealander (18.3%, a difference of 0.51%), and Immigrants from Bulgaria (18.3%, a difference of 0.74%).
| Demographics | Rating | Rank | Master's Degree |
| Immigrants | Serbia | 99.9 /100 | #55 | Exceptional 18.5% |
| Asians | 99.9 /100 | #56 | Exceptional 18.4% |
| Immigrants | Asia | 99.9 /100 | #57 | Exceptional 18.4% |
| Australians | 99.9 /100 | #58 | Exceptional 18.4% |
| Immigrants | Bulgaria | 99.9 /100 | #59 | Exceptional 18.3% |
| New Zealanders | 99.9 /100 | #60 | Exceptional 18.3% |
| Immigrants | Europe | 99.9 /100 | #61 | Exceptional 18.2% |
| Argentineans | 99.9 /100 | #62 | Exceptional 18.2% |
| Immigrants | Netherlands | 99.9 /100 | #63 | Exceptional 18.1% |
| South Africans | 99.9 /100 | #64 | Exceptional 18.1% |
| Immigrants | Kazakhstan | 99.8 /100 | #65 | Exceptional 18.0% |
| Ethiopians | 99.8 /100 | #66 | Exceptional 18.0% |
| Immigrants | Argentina | 99.8 /100 | #67 | Exceptional 18.0% |
| Immigrants | Ethiopia | 99.8 /100 | #68 | Exceptional 17.9% |
| Immigrants | Uzbekistan | 99.8 /100 | #69 | Exceptional 17.9% |
Demographics Similar to Trinidadians and Tobagonians by Master's Degree
In terms of master's degree, the demographic groups most similar to Trinidadians and Tobagonians are French (14.4%, a difference of 0.030%), Scandinavian (14.4%, a difference of 0.040%), Yugoslavian (14.4%, a difference of 0.15%), Immigrants from Western Africa (14.4%, a difference of 0.26%), and Scotch-Irish (14.4%, a difference of 0.27%).
| Demographics | Rating | Rank | Master's Degree |
| West Indians | 27.4 /100 | #198 | Fair 14.5% |
| Immigrants | Armenia | 27.2 /100 | #199 | Fair 14.5% |
| Panamanians | 25.1 /100 | #200 | Fair 14.4% |
| Scotch-Irish | 25.0 /100 | #201 | Fair 14.4% |
| Immigrants | Western Africa | 24.9 /100 | #202 | Fair 14.4% |
| Yugoslavians | 24.3 /100 | #203 | Fair 14.4% |
| French | 23.7 /100 | #204 | Fair 14.4% |
| Trinidadians and Tobagonians | 23.5 /100 | #205 | Fair 14.4% |
| Scandinavians | 23.3 /100 | #206 | Fair 14.4% |
| Immigrants | Bosnia and Herzegovina | 22.0 /100 | #207 | Fair 14.3% |
| Immigrants | Barbados | 20.5 /100 | #208 | Fair 14.3% |
| Immigrants | Panama | 20.0 /100 | #209 | Fair 14.3% |
| Sub-Saharan Africans | 19.4 /100 | #210 | Poor 14.2% |
| Somalis | 18.0 /100 | #211 | Poor 14.2% |
| Spanish | 17.8 /100 | #212 | Poor 14.2% |