Venezuelan vs Trinidadian and Tobagonian Master's Degree
COMPARE
Venezuelan
Trinidadian and Tobagonian
Master's Degree
Master's Degree Comparison
Venezuelans
Trinidadians and Tobagonians
15.9%
MASTER'S DEGREE
88.4/ 100
METRIC RATING
134th/ 347
METRIC RANK
14.4%
MASTER'S DEGREE
23.5/ 100
METRIC RATING
205th/ 347
METRIC RANK
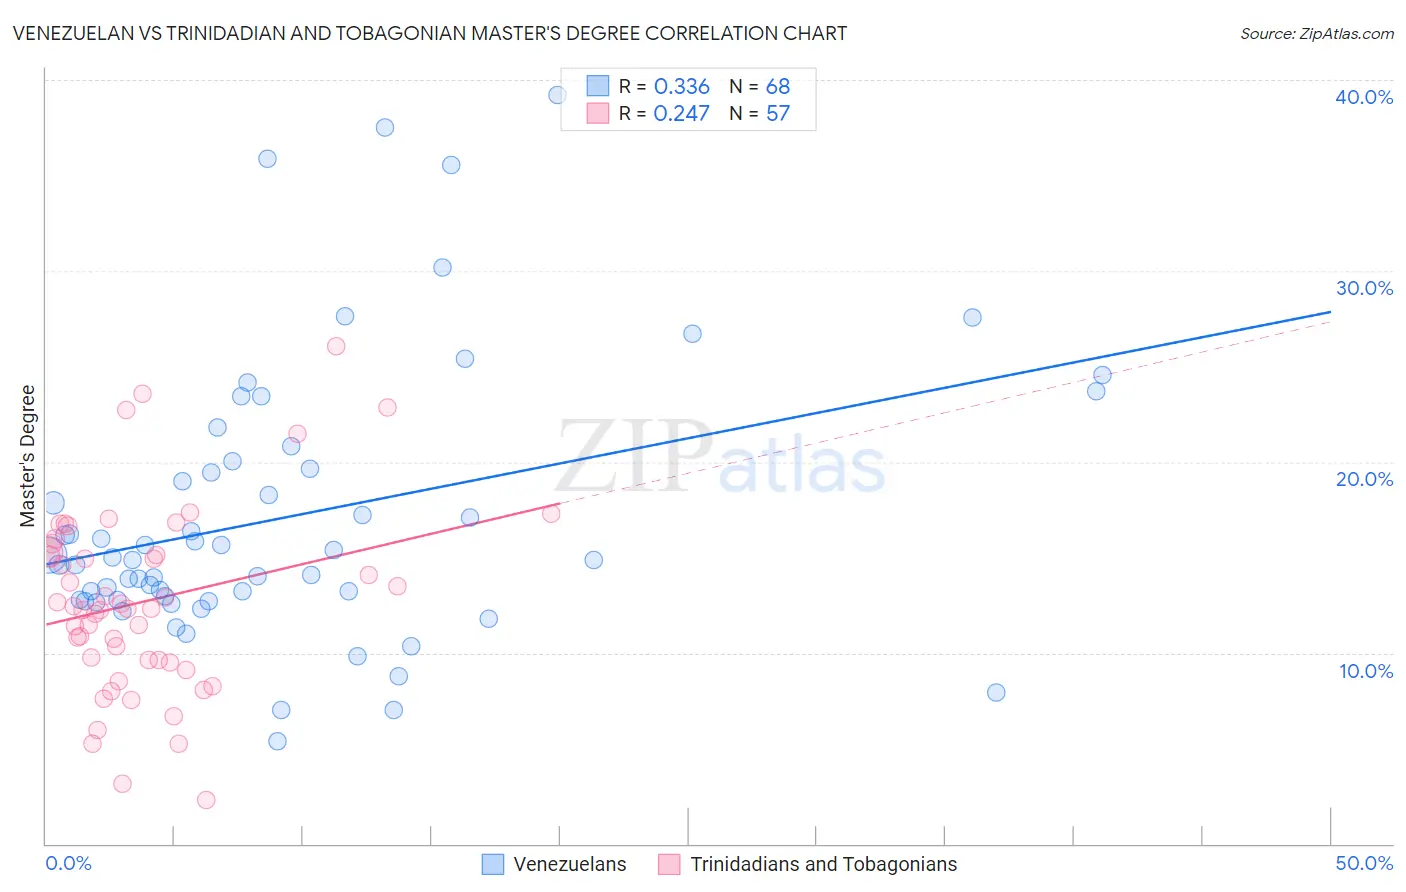
Venezuelan vs Trinidadian and Tobagonian Master's Degree Correlation Chart
The statistical analysis conducted on geographies consisting of 306,249,959 people shows a mild positive correlation between the proportion of Venezuelans and percentage of population with at least master's degree education in the United States with a correlation coefficient (R) of 0.336 and weighted average of 15.9%. Similarly, the statistical analysis conducted on geographies consisting of 219,795,372 people shows a weak positive correlation between the proportion of Trinidadians and Tobagonians and percentage of population with at least master's degree education in the United States with a correlation coefficient (R) of 0.247 and weighted average of 14.4%, a difference of 10.7%.
Master's Degree Correlation Summary
| Measurement | Venezuelan | Trinidadian and Tobagonian |
| Minimum | 5.4% | 2.3% |
| Maximum | 39.2% | 26.1% |
| Range | 33.8% | 23.8% |
| Mean | 17.1% | 12.7% |
| Median | 14.9% | 12.3% |
| Interquartile 25% (IQ1) | 12.8% | 9.6% |
| Interquartile 75% (IQ3) | 19.8% | 15.5% |
| Interquartile Range (IQR) | 7.1% | 5.9% |
| Standard Deviation (Sample) | 7.2% | 4.9% |
| Standard Deviation (Population) | 7.2% | 4.9% |
Similar Demographics by Master's Degree
Demographics Similar to Venezuelans by Master's Degree
In terms of master's degree, the demographic groups most similar to Venezuelans are South American Indian (15.9%, a difference of 0.0%), Assyrian/Chaldean/Syriac (15.8%, a difference of 0.45%), Immigrants from Sudan (16.0%, a difference of 0.56%), European (15.8%, a difference of 0.56%), and Pakistani (15.8%, a difference of 0.64%).
| Demographics | Rating | Rank | Master's Degree |
| Palestinians | 94.8 /100 | #127 | Exceptional 16.3% |
| Immigrants | Sierra Leone | 94.7 /100 | #128 | Exceptional 16.3% |
| Immigrants | Syria | 93.3 /100 | #129 | Exceptional 16.2% |
| Immigrants | Jordan | 92.7 /100 | #130 | Exceptional 16.1% |
| Taiwanese | 91.9 /100 | #131 | Exceptional 16.1% |
| Serbians | 91.7 /100 | #132 | Exceptional 16.1% |
| Immigrants | Sudan | 90.2 /100 | #133 | Exceptional 16.0% |
| Venezuelans | 88.4 /100 | #134 | Excellent 15.9% |
| South American Indians | 88.4 /100 | #135 | Excellent 15.9% |
| Assyrians/Chaldeans/Syriacs | 86.8 /100 | #136 | Excellent 15.8% |
| Europeans | 86.4 /100 | #137 | Excellent 15.8% |
| Pakistanis | 86.1 /100 | #138 | Excellent 15.8% |
| Immigrants | Germany | 85.9 /100 | #139 | Excellent 15.8% |
| Vietnamese | 85.5 /100 | #140 | Excellent 15.8% |
| Poles | 85.0 /100 | #141 | Excellent 15.7% |
Demographics Similar to Trinidadians and Tobagonians by Master's Degree
In terms of master's degree, the demographic groups most similar to Trinidadians and Tobagonians are French (14.4%, a difference of 0.030%), Scandinavian (14.4%, a difference of 0.040%), Yugoslavian (14.4%, a difference of 0.15%), Immigrants from Western Africa (14.4%, a difference of 0.26%), and Scotch-Irish (14.4%, a difference of 0.27%).
| Demographics | Rating | Rank | Master's Degree |
| West Indians | 27.4 /100 | #198 | Fair 14.5% |
| Immigrants | Armenia | 27.2 /100 | #199 | Fair 14.5% |
| Panamanians | 25.1 /100 | #200 | Fair 14.4% |
| Scotch-Irish | 25.0 /100 | #201 | Fair 14.4% |
| Immigrants | Western Africa | 24.9 /100 | #202 | Fair 14.4% |
| Yugoslavians | 24.3 /100 | #203 | Fair 14.4% |
| French | 23.7 /100 | #204 | Fair 14.4% |
| Trinidadians and Tobagonians | 23.5 /100 | #205 | Fair 14.4% |
| Scandinavians | 23.3 /100 | #206 | Fair 14.4% |
| Immigrants | Bosnia and Herzegovina | 22.0 /100 | #207 | Fair 14.3% |
| Immigrants | Barbados | 20.5 /100 | #208 | Fair 14.3% |
| Immigrants | Panama | 20.0 /100 | #209 | Fair 14.3% |
| Sub-Saharan Africans | 19.4 /100 | #210 | Poor 14.2% |
| Somalis | 18.0 /100 | #211 | Poor 14.2% |
| Spanish | 17.8 /100 | #212 | Poor 14.2% |