Cree vs Native Hawaiian High School Diploma
COMPARE
Cree
Native Hawaiian
High School Diploma
High School Diploma Comparison
Cree
Native Hawaiians
89.3%
HIGH SCHOOL DIPLOMA
61.1/ 100
METRIC RATING
163rd/ 347
METRIC RANK
90.8%
HIGH SCHOOL DIPLOMA
99.3/ 100
METRIC RATING
77th/ 347
METRIC RANK
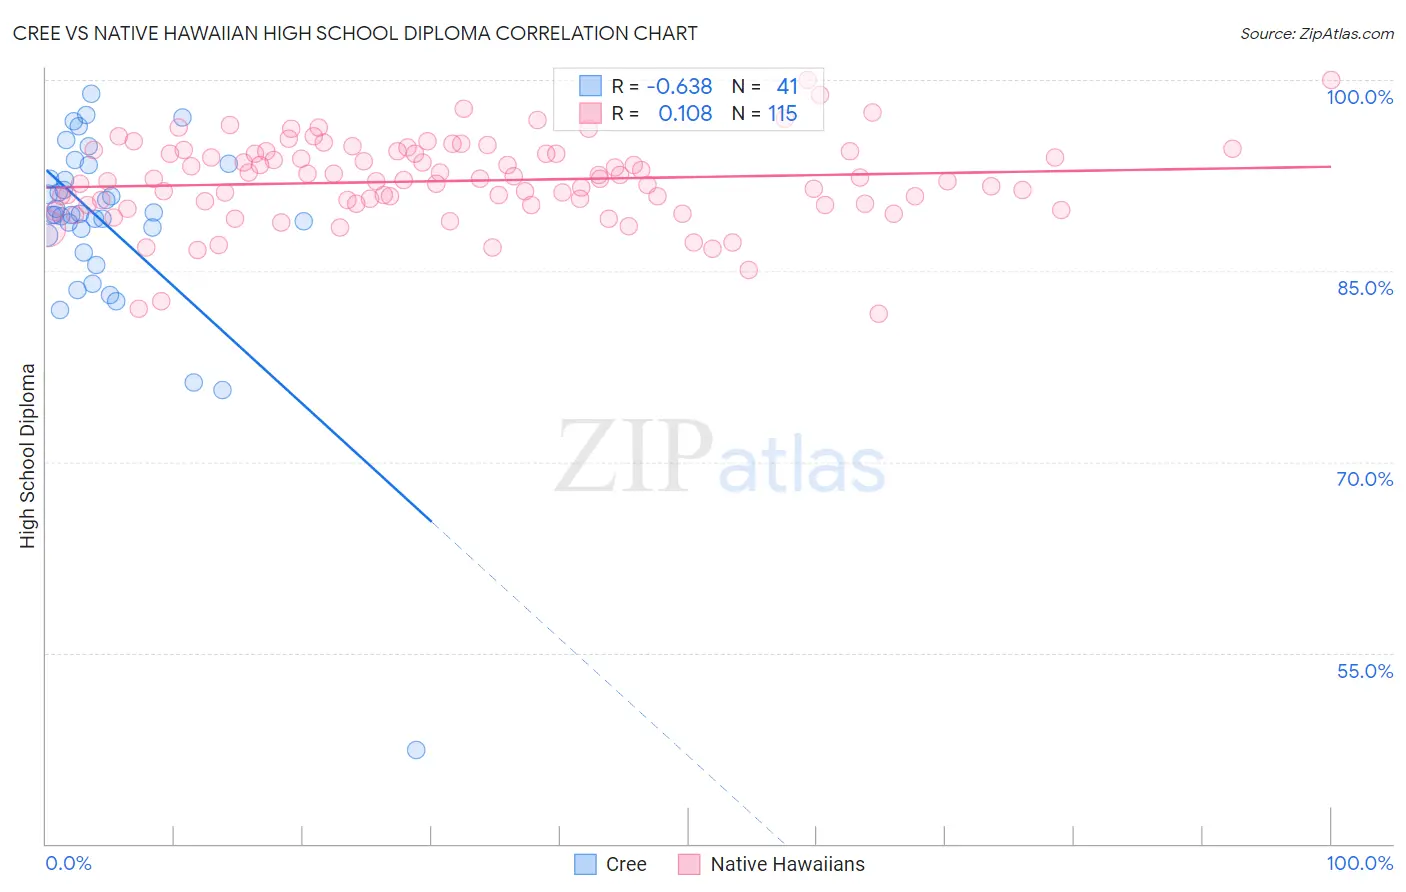
Cree vs Native Hawaiian High School Diploma Correlation Chart
The statistical analysis conducted on geographies consisting of 76,211,744 people shows a significant negative correlation between the proportion of Cree and percentage of population with at least high school diploma education in the United States with a correlation coefficient (R) of -0.638 and weighted average of 89.3%. Similarly, the statistical analysis conducted on geographies consisting of 332,118,930 people shows a poor positive correlation between the proportion of Native Hawaiians and percentage of population with at least high school diploma education in the United States with a correlation coefficient (R) of 0.108 and weighted average of 90.8%, a difference of 1.7%.
High School Diploma Correlation Summary
| Measurement | Cree | Native Hawaiian |
| Minimum | 47.4% | 81.6% |
| Maximum | 98.9% | 100.0% |
| Range | 51.6% | 18.4% |
| Mean | 88.5% | 92.1% |
| Median | 89.4% | 92.2% |
| Interquartile 25% (IQ1) | 87.1% | 90.3% |
| Interquartile 75% (IQ3) | 92.8% | 94.4% |
| Interquartile Range (IQR) | 5.7% | 4.1% |
| Standard Deviation (Sample) | 8.3% | 3.3% |
| Standard Deviation (Population) | 8.2% | 3.3% |
Similar Demographics by High School Diploma
Demographics Similar to Cree by High School Diploma
In terms of high school diploma, the demographic groups most similar to Cree are Brazilian (89.3%, a difference of 0.0%), Bermudan (89.3%, a difference of 0.0%), Immigrants from Nepal (89.3%, a difference of 0.0%), Immigrants from China (89.3%, a difference of 0.010%), and Laotian (89.3%, a difference of 0.010%).
| Demographics | Rating | Rank | High School Diploma |
| Immigrants | Argentina | 65.5 /100 | #156 | Good 89.4% |
| Immigrants | Malaysia | 63.5 /100 | #157 | Good 89.3% |
| Immigrants | Pakistan | 62.5 /100 | #158 | Good 89.3% |
| Immigrants | China | 62.0 /100 | #159 | Good 89.3% |
| Laotians | 61.8 /100 | #160 | Good 89.3% |
| Brazilians | 61.2 /100 | #161 | Good 89.3% |
| Bermudans | 61.1 /100 | #162 | Good 89.3% |
| Cree | 61.1 /100 | #163 | Good 89.3% |
| Immigrants | Nepal | 61.1 /100 | #164 | Good 89.3% |
| Immigrants | Asia | 59.8 /100 | #165 | Average 89.3% |
| Immigrants | Albania | 59.4 /100 | #166 | Average 89.3% |
| Immigrants | Hong Kong | 58.6 /100 | #167 | Average 89.3% |
| Delaware | 55.8 /100 | #168 | Average 89.2% |
| Iroquois | 55.1 /100 | #169 | Average 89.2% |
| Immigrants | Morocco | 53.3 /100 | #170 | Average 89.2% |
Demographics Similar to Native Hawaiians by High School Diploma
In terms of high school diploma, the demographic groups most similar to Native Hawaiians are Burmese (90.8%, a difference of 0.0%), Hungarian (90.8%, a difference of 0.010%), Immigrants from Denmark (90.8%, a difference of 0.010%), Cambodian (90.8%, a difference of 0.020%), and Immigrants from England (90.8%, a difference of 0.020%).
| Demographics | Rating | Rank | High School Diploma |
| Immigrants | Latvia | 99.5 /100 | #70 | Exceptional 90.9% |
| Alaskan Athabascans | 99.4 /100 | #71 | Exceptional 90.9% |
| Soviet Union | 99.4 /100 | #72 | Exceptional 90.9% |
| Immigrants | South Central Asia | 99.4 /100 | #73 | Exceptional 90.9% |
| Immigrants | Czechoslovakia | 99.4 /100 | #74 | Exceptional 90.9% |
| Cambodians | 99.4 /100 | #75 | Exceptional 90.8% |
| Hungarians | 99.3 /100 | #76 | Exceptional 90.8% |
| Native Hawaiians | 99.3 /100 | #77 | Exceptional 90.8% |
| Burmese | 99.3 /100 | #78 | Exceptional 90.8% |
| Immigrants | Denmark | 99.3 /100 | #79 | Exceptional 90.8% |
| Immigrants | England | 99.3 /100 | #80 | Exceptional 90.8% |
| Immigrants | Switzerland | 99.3 /100 | #81 | Exceptional 90.8% |
| Scotch-Irish | 99.2 /100 | #82 | Exceptional 90.8% |
| Immigrants | Moldova | 99.2 /100 | #83 | Exceptional 90.7% |
| Immigrants | Saudi Arabia | 99.1 /100 | #84 | Exceptional 90.7% |