Black/African American vs Immigrants from Ecuador High School Diploma
COMPARE
Black/African American
Immigrants from Ecuador
High School Diploma
High School Diploma Comparison
Blacks/African Americans
Immigrants from Ecuador
87.0%
HIGH SCHOOL DIPLOMA
0.2/ 100
METRIC RATING
267th/ 347
METRIC RANK
84.8%
HIGH SCHOOL DIPLOMA
0.0/ 100
METRIC RATING
313th/ 347
METRIC RANK
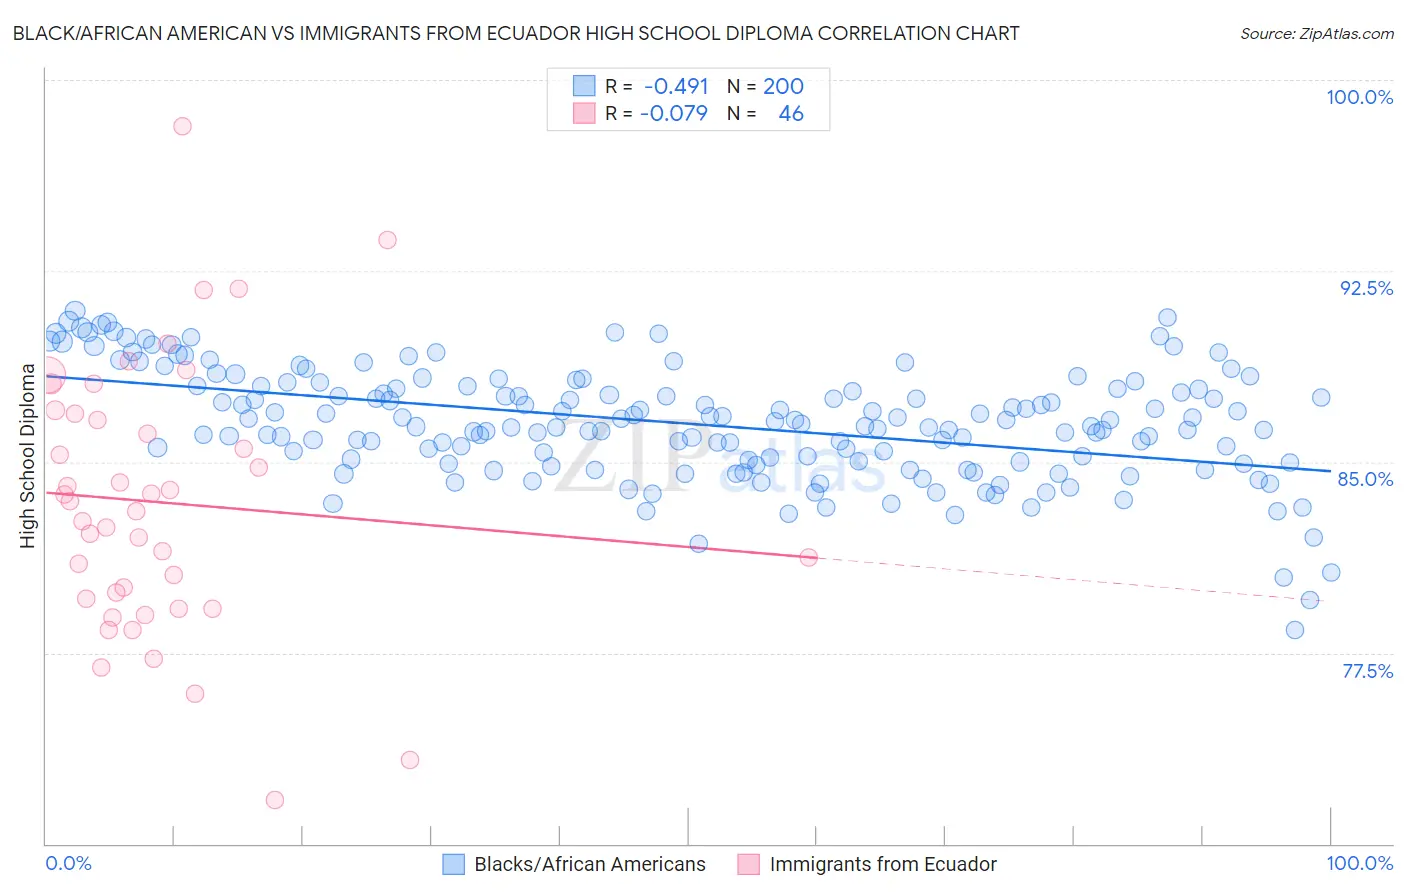
Black/African American vs Immigrants from Ecuador High School Diploma Correlation Chart
The statistical analysis conducted on geographies consisting of 566,048,038 people shows a moderate negative correlation between the proportion of Blacks/African Americans and percentage of population with at least high school diploma education in the United States with a correlation coefficient (R) of -0.491 and weighted average of 87.0%. Similarly, the statistical analysis conducted on geographies consisting of 270,907,929 people shows a slight negative correlation between the proportion of Immigrants from Ecuador and percentage of population with at least high school diploma education in the United States with a correlation coefficient (R) of -0.079 and weighted average of 84.8%, a difference of 2.6%.
High School Diploma Correlation Summary
| Measurement | Black/African American | Immigrants from Ecuador |
| Minimum | 78.4% | 71.7% |
| Maximum | 90.9% | 98.2% |
| Range | 12.5% | 26.5% |
| Mean | 86.5% | 83.4% |
| Median | 86.4% | 83.3% |
| Interquartile 25% (IQ1) | 85.0% | 79.6% |
| Interquartile 75% (IQ3) | 88.0% | 86.9% |
| Interquartile Range (IQR) | 3.0% | 7.3% |
| Standard Deviation (Sample) | 2.2% | 5.3% |
| Standard Deviation (Population) | 2.2% | 5.2% |
Similar Demographics by High School Diploma
Demographics Similar to Blacks/African Americans by High School Diploma
In terms of high school diploma, the demographic groups most similar to Blacks/African Americans are Immigrants from Congo (87.0%, a difference of 0.010%), Pennsylvania German (87.0%, a difference of 0.030%), Sri Lankan (87.0%, a difference of 0.040%), U.S. Virgin Islander (87.1%, a difference of 0.060%), and Malaysian (87.0%, a difference of 0.060%).
| Demographics | Rating | Rank | High School Diploma |
| Cajuns | 0.4 /100 | #260 | Tragic 87.3% |
| Seminole | 0.4 /100 | #261 | Tragic 87.3% |
| Immigrants | Peru | 0.4 /100 | #262 | Tragic 87.3% |
| Immigrants | South Eastern Asia | 0.3 /100 | #263 | Tragic 87.2% |
| Jamaicans | 0.3 /100 | #264 | Tragic 87.2% |
| U.S. Virgin Islanders | 0.2 /100 | #265 | Tragic 87.1% |
| Immigrants | Congo | 0.2 /100 | #266 | Tragic 87.0% |
| Blacks/African Americans | 0.2 /100 | #267 | Tragic 87.0% |
| Pennsylvania Germans | 0.2 /100 | #268 | Tragic 87.0% |
| Sri Lankans | 0.2 /100 | #269 | Tragic 87.0% |
| Malaysians | 0.2 /100 | #270 | Tragic 87.0% |
| West Indians | 0.1 /100 | #271 | Tragic 86.9% |
| Trinidadians and Tobagonians | 0.1 /100 | #272 | Tragic 86.9% |
| Immigrants | Jamaica | 0.1 /100 | #273 | Tragic 86.9% |
| Bangladeshis | 0.1 /100 | #274 | Tragic 86.9% |
Demographics Similar to Immigrants from Ecuador by High School Diploma
In terms of high school diploma, the demographic groups most similar to Immigrants from Ecuador are Yaqui (84.7%, a difference of 0.11%), Puerto Rican (84.7%, a difference of 0.20%), Cape Verdean (85.1%, a difference of 0.26%), Ecuadorian (85.1%, a difference of 0.31%), and Apache (85.1%, a difference of 0.32%).
| Demographics | Rating | Rank | High School Diploma |
| Immigrants | Guyana | 0.0 /100 | #306 | Tragic 85.3% |
| Navajo | 0.0 /100 | #307 | Tragic 85.2% |
| Immigrants | Armenia | 0.0 /100 | #308 | Tragic 85.2% |
| Immigrants | Dominica | 0.0 /100 | #309 | Tragic 85.2% |
| Apache | 0.0 /100 | #310 | Tragic 85.1% |
| Ecuadorians | 0.0 /100 | #311 | Tragic 85.1% |
| Cape Verdeans | 0.0 /100 | #312 | Tragic 85.1% |
| Immigrants | Ecuador | 0.0 /100 | #313 | Tragic 84.8% |
| Yaqui | 0.0 /100 | #314 | Tragic 84.7% |
| Puerto Ricans | 0.0 /100 | #315 | Tragic 84.7% |
| Belizeans | 0.0 /100 | #316 | Tragic 84.3% |
| Immigrants | Caribbean | 0.0 /100 | #317 | Tragic 84.3% |
| Immigrants | Belize | 0.0 /100 | #318 | Tragic 84.2% |
| Central American Indians | 0.0 /100 | #319 | Tragic 84.2% |
| Nicaraguans | 0.0 /100 | #320 | Tragic 84.1% |