Cree vs Immigrants from Sweden High School Diploma
COMPARE
Cree
Immigrants from Sweden
High School Diploma
High School Diploma Comparison
Cree
Immigrants from Sweden
89.3%
HIGH SCHOOL DIPLOMA
61.1/ 100
METRIC RATING
163rd/ 347
METRIC RANK
91.1%
HIGH SCHOOL DIPLOMA
99.7/ 100
METRIC RATING
52nd/ 347
METRIC RANK
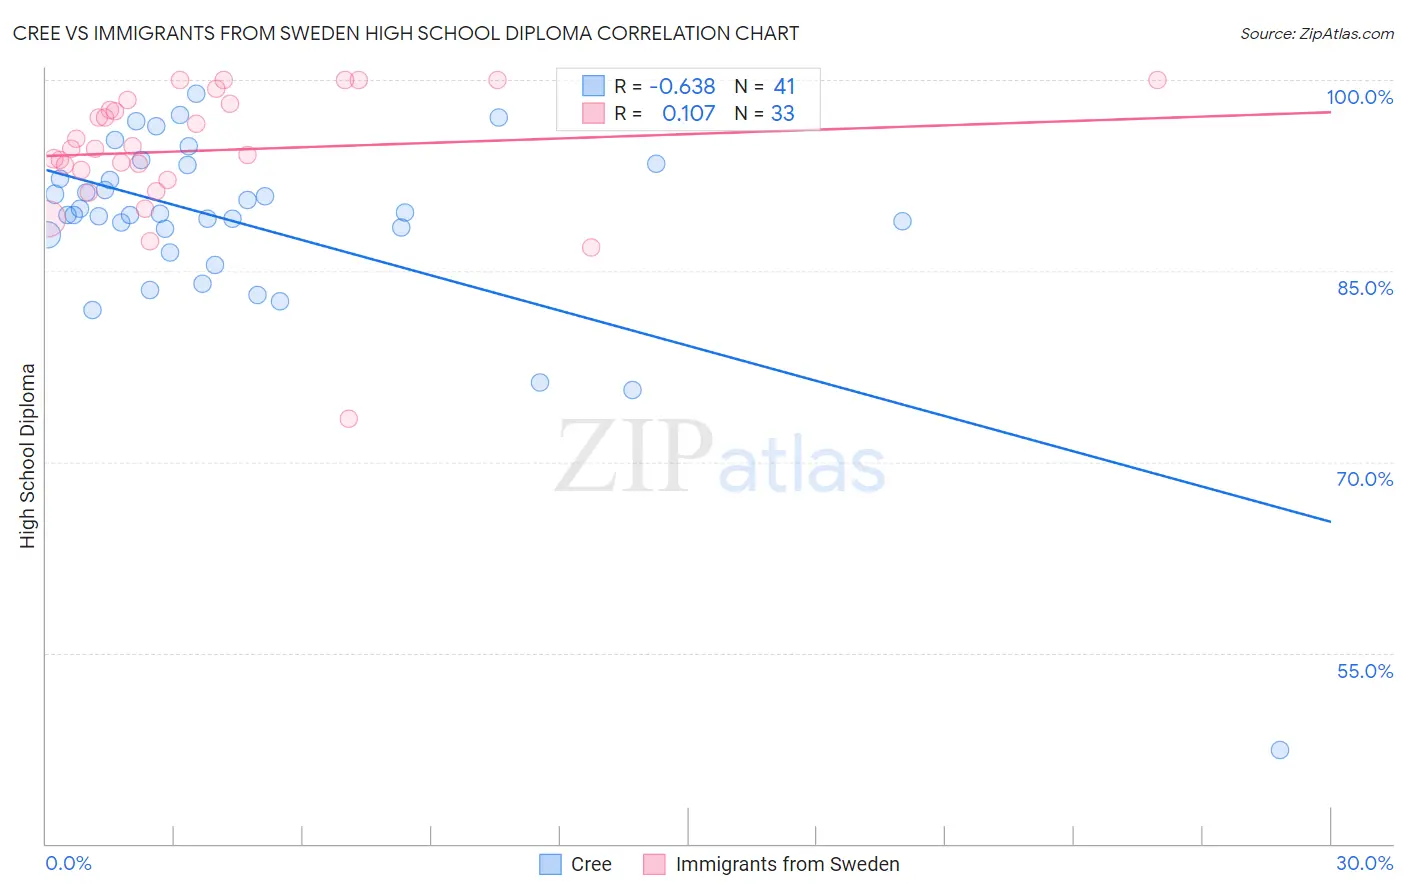
Cree vs Immigrants from Sweden High School Diploma Correlation Chart
The statistical analysis conducted on geographies consisting of 76,211,744 people shows a significant negative correlation between the proportion of Cree and percentage of population with at least high school diploma education in the United States with a correlation coefficient (R) of -0.638 and weighted average of 89.3%. Similarly, the statistical analysis conducted on geographies consisting of 164,737,092 people shows a poor positive correlation between the proportion of Immigrants from Sweden and percentage of population with at least high school diploma education in the United States with a correlation coefficient (R) of 0.107 and weighted average of 91.1%, a difference of 2.1%.
High School Diploma Correlation Summary
| Measurement | Cree | Immigrants from Sweden |
| Minimum | 47.4% | 73.4% |
| Maximum | 98.9% | 100.0% |
| Range | 51.6% | 26.6% |
| Mean | 88.5% | 94.5% |
| Median | 89.4% | 94.6% |
| Interquartile 25% (IQ1) | 87.1% | 92.5% |
| Interquartile 75% (IQ3) | 92.8% | 98.3% |
| Interquartile Range (IQR) | 5.7% | 5.8% |
| Standard Deviation (Sample) | 8.3% | 5.3% |
| Standard Deviation (Population) | 8.2% | 5.3% |
Similar Demographics by High School Diploma
Demographics Similar to Cree by High School Diploma
In terms of high school diploma, the demographic groups most similar to Cree are Brazilian (89.3%, a difference of 0.0%), Bermudan (89.3%, a difference of 0.0%), Immigrants from Nepal (89.3%, a difference of 0.0%), Immigrants from China (89.3%, a difference of 0.010%), and Laotian (89.3%, a difference of 0.010%).
| Demographics | Rating | Rank | High School Diploma |
| Immigrants | Argentina | 65.5 /100 | #156 | Good 89.4% |
| Immigrants | Malaysia | 63.5 /100 | #157 | Good 89.3% |
| Immigrants | Pakistan | 62.5 /100 | #158 | Good 89.3% |
| Immigrants | China | 62.0 /100 | #159 | Good 89.3% |
| Laotians | 61.8 /100 | #160 | Good 89.3% |
| Brazilians | 61.2 /100 | #161 | Good 89.3% |
| Bermudans | 61.1 /100 | #162 | Good 89.3% |
| Cree | 61.1 /100 | #163 | Good 89.3% |
| Immigrants | Nepal | 61.1 /100 | #164 | Good 89.3% |
| Immigrants | Asia | 59.8 /100 | #165 | Average 89.3% |
| Immigrants | Albania | 59.4 /100 | #166 | Average 89.3% |
| Immigrants | Hong Kong | 58.6 /100 | #167 | Average 89.3% |
| Delaware | 55.8 /100 | #168 | Average 89.2% |
| Iroquois | 55.1 /100 | #169 | Average 89.2% |
| Immigrants | Morocco | 53.3 /100 | #170 | Average 89.2% |
Demographics Similar to Immigrants from Sweden by High School Diploma
In terms of high school diploma, the demographic groups most similar to Immigrants from Sweden are New Zealander (91.1%, a difference of 0.0%), Immigrants from Belgium (91.1%, a difference of 0.0%), Macedonian (91.1%, a difference of 0.020%), Serbian (91.1%, a difference of 0.030%), and Welsh (91.2%, a difference of 0.050%).
| Demographics | Rating | Rank | High School Diploma |
| Turks | 99.8 /100 | #45 | Exceptional 91.2% |
| Greeks | 99.8 /100 | #46 | Exceptional 91.2% |
| Australians | 99.8 /100 | #47 | Exceptional 91.2% |
| Belgians | 99.8 /100 | #48 | Exceptional 91.2% |
| Bhutanese | 99.8 /100 | #49 | Exceptional 91.2% |
| Welsh | 99.8 /100 | #50 | Exceptional 91.2% |
| New Zealanders | 99.7 /100 | #51 | Exceptional 91.1% |
| Immigrants | Sweden | 99.7 /100 | #52 | Exceptional 91.1% |
| Immigrants | Belgium | 99.7 /100 | #53 | Exceptional 91.1% |
| Macedonians | 99.7 /100 | #54 | Exceptional 91.1% |
| Serbians | 99.7 /100 | #55 | Exceptional 91.1% |
| Immigrants | Canada | 99.7 /100 | #56 | Exceptional 91.1% |
| Zimbabweans | 99.7 /100 | #57 | Exceptional 91.1% |
| Slavs | 99.7 /100 | #58 | Exceptional 91.0% |
| Immigrants | North America | 99.7 /100 | #59 | Exceptional 91.0% |