Cree vs American High School Diploma
COMPARE
Cree
American
High School Diploma
High School Diploma Comparison
Cree
Americans
89.3%
HIGH SCHOOL DIPLOMA
61.1/ 100
METRIC RATING
163rd/ 347
METRIC RANK
89.1%
HIGH SCHOOL DIPLOMA
47.2/ 100
METRIC RATING
179th/ 347
METRIC RANK
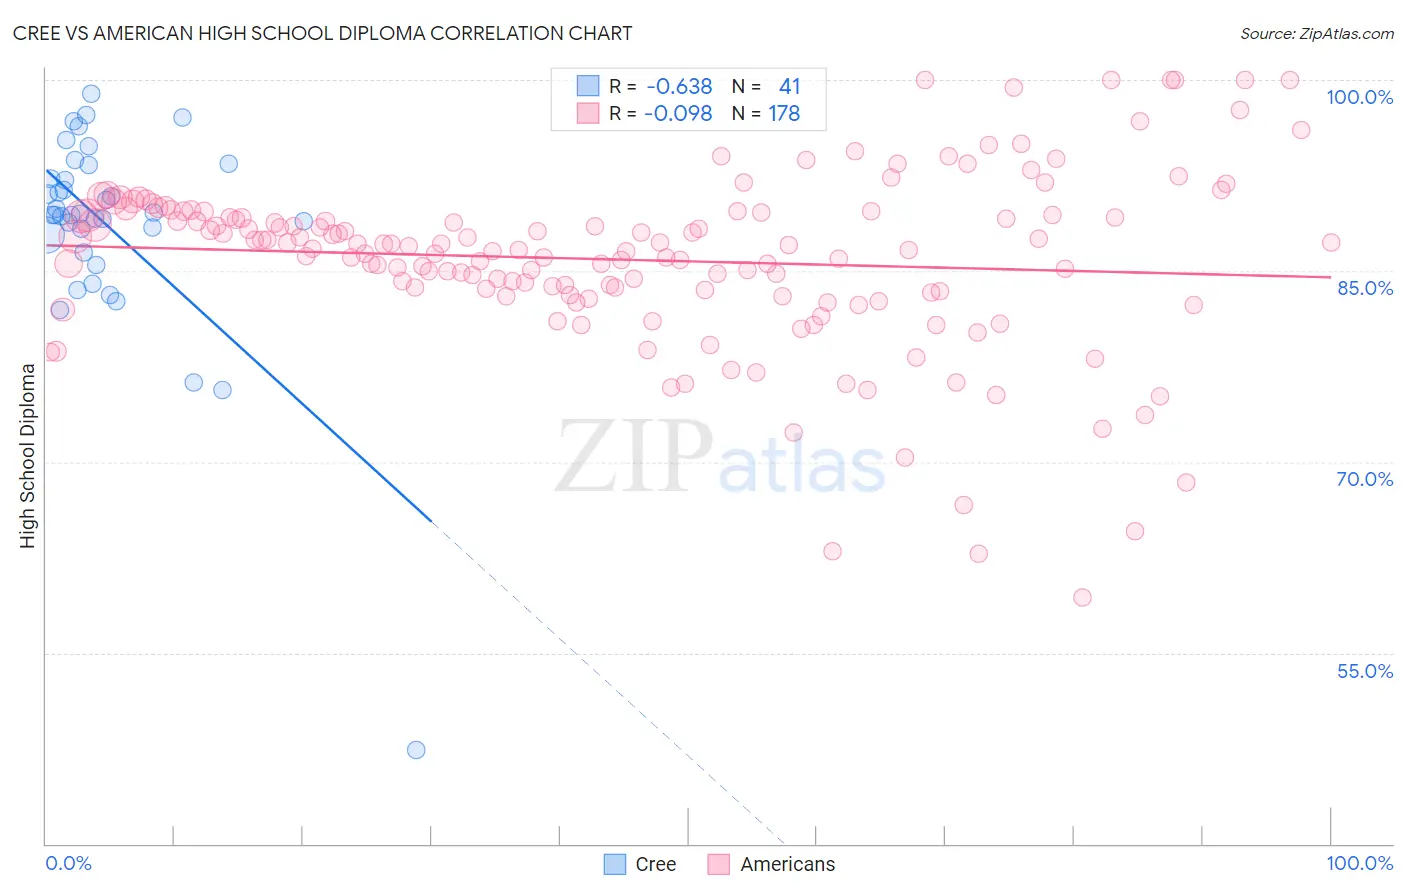
Cree vs American High School Diploma Correlation Chart
The statistical analysis conducted on geographies consisting of 76,211,744 people shows a significant negative correlation between the proportion of Cree and percentage of population with at least high school diploma education in the United States with a correlation coefficient (R) of -0.638 and weighted average of 89.3%. Similarly, the statistical analysis conducted on geographies consisting of 581,993,169 people shows a slight negative correlation between the proportion of Americans and percentage of population with at least high school diploma education in the United States with a correlation coefficient (R) of -0.098 and weighted average of 89.1%, a difference of 0.21%.
High School Diploma Correlation Summary
| Measurement | Cree | American |
| Minimum | 47.4% | 59.3% |
| Maximum | 98.9% | 100.0% |
| Range | 51.6% | 40.7% |
| Mean | 88.5% | 85.9% |
| Median | 89.4% | 86.8% |
| Interquartile 25% (IQ1) | 87.1% | 83.3% |
| Interquartile 75% (IQ3) | 92.8% | 89.4% |
| Interquartile Range (IQR) | 5.7% | 6.1% |
| Standard Deviation (Sample) | 8.3% | 6.9% |
| Standard Deviation (Population) | 8.2% | 6.9% |
Demographics Similar to Cree and Americans by High School Diploma
In terms of high school diploma, the demographic groups most similar to Cree are Brazilian (89.3%, a difference of 0.0%), Bermudan (89.3%, a difference of 0.0%), Immigrants from Nepal (89.3%, a difference of 0.0%), Immigrants from Asia (89.3%, a difference of 0.020%), and Immigrants from Albania (89.3%, a difference of 0.030%). Similarly, the demographic groups most similar to Americans are Osage (89.1%, a difference of 0.020%), Sudanese (89.1%, a difference of 0.020%), Sierra Leonean (89.1%, a difference of 0.020%), Immigrants from Western Asia (89.1%, a difference of 0.030%), and Bolivian (89.1%, a difference of 0.030%).
| Demographics | Rating | Rank | High School Diploma |
| Brazilians | 61.2 /100 | #161 | Good 89.3% |
| Bermudans | 61.1 /100 | #162 | Good 89.3% |
| Cree | 61.1 /100 | #163 | Good 89.3% |
| Immigrants | Nepal | 61.1 /100 | #164 | Good 89.3% |
| Immigrants | Asia | 59.8 /100 | #165 | Average 89.3% |
| Immigrants | Albania | 59.4 /100 | #166 | Average 89.3% |
| Immigrants | Hong Kong | 58.6 /100 | #167 | Average 89.3% |
| Delaware | 55.8 /100 | #168 | Average 89.2% |
| Iroquois | 55.1 /100 | #169 | Average 89.2% |
| Immigrants | Morocco | 53.3 /100 | #170 | Average 89.2% |
| Spanish | 52.9 /100 | #171 | Average 89.2% |
| Immigrants | Nonimmigrants | 51.8 /100 | #172 | Average 89.2% |
| Immigrants | Indonesia | 50.3 /100 | #173 | Average 89.1% |
| Hmong | 50.0 /100 | #174 | Average 89.1% |
| Immigrants | Western Asia | 49.0 /100 | #175 | Average 89.1% |
| Osage | 48.9 /100 | #176 | Average 89.1% |
| Sudanese | 48.5 /100 | #177 | Average 89.1% |
| Sierra Leoneans | 48.4 /100 | #178 | Average 89.1% |
| Americans | 47.2 /100 | #179 | Average 89.1% |
| Bolivians | 45.2 /100 | #180 | Average 89.1% |
| Venezuelans | 43.6 /100 | #181 | Average 89.1% |