Cree vs Immigrants from Vietnam High School Diploma
COMPARE
Cree
Immigrants from Vietnam
High School Diploma
High School Diploma Comparison
Cree
Immigrants from Vietnam
89.3%
HIGH SCHOOL DIPLOMA
61.1/ 100
METRIC RATING
163rd/ 347
METRIC RANK
86.2%
HIGH SCHOOL DIPLOMA
0.0/ 100
METRIC RATING
288th/ 347
METRIC RANK
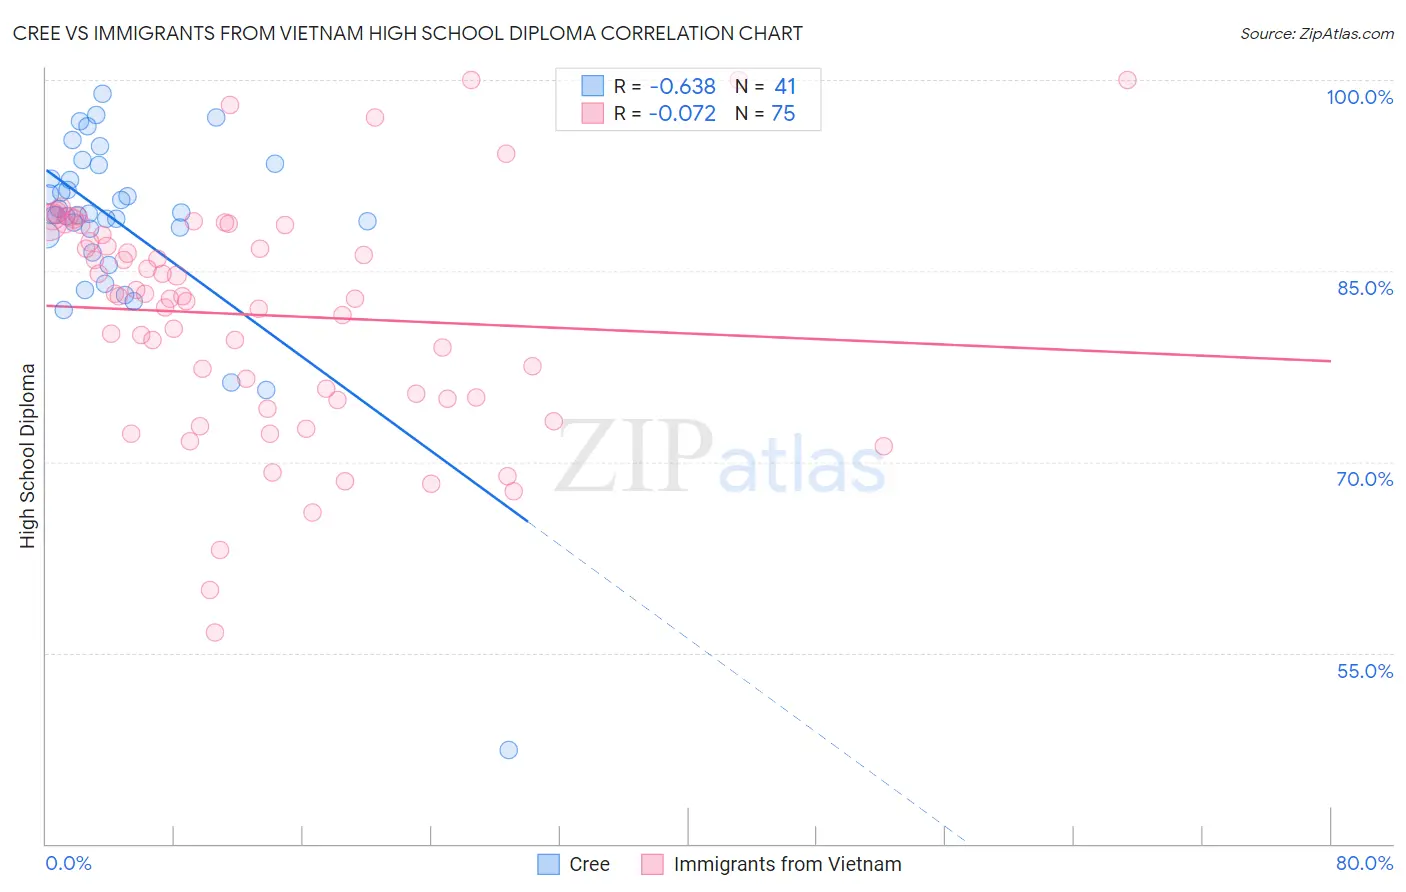
Cree vs Immigrants from Vietnam High School Diploma Correlation Chart
The statistical analysis conducted on geographies consisting of 76,211,744 people shows a significant negative correlation between the proportion of Cree and percentage of population with at least high school diploma education in the United States with a correlation coefficient (R) of -0.638 and weighted average of 89.3%. Similarly, the statistical analysis conducted on geographies consisting of 404,843,921 people shows a slight negative correlation between the proportion of Immigrants from Vietnam and percentage of population with at least high school diploma education in the United States with a correlation coefficient (R) of -0.072 and weighted average of 86.2%, a difference of 3.6%.
High School Diploma Correlation Summary
| Measurement | Cree | Immigrants from Vietnam |
| Minimum | 47.4% | 56.6% |
| Maximum | 98.9% | 100.0% |
| Range | 51.6% | 43.4% |
| Mean | 88.5% | 81.5% |
| Median | 89.4% | 83.0% |
| Interquartile 25% (IQ1) | 87.1% | 75.0% |
| Interquartile 75% (IQ3) | 92.8% | 88.6% |
| Interquartile Range (IQR) | 5.7% | 13.6% |
| Standard Deviation (Sample) | 8.3% | 9.2% |
| Standard Deviation (Population) | 8.2% | 9.1% |
Similar Demographics by High School Diploma
Demographics Similar to Cree by High School Diploma
In terms of high school diploma, the demographic groups most similar to Cree are Brazilian (89.3%, a difference of 0.0%), Bermudan (89.3%, a difference of 0.0%), Immigrants from Nepal (89.3%, a difference of 0.0%), Immigrants from China (89.3%, a difference of 0.010%), and Laotian (89.3%, a difference of 0.010%).
| Demographics | Rating | Rank | High School Diploma |
| Immigrants | Argentina | 65.5 /100 | #156 | Good 89.4% |
| Immigrants | Malaysia | 63.5 /100 | #157 | Good 89.3% |
| Immigrants | Pakistan | 62.5 /100 | #158 | Good 89.3% |
| Immigrants | China | 62.0 /100 | #159 | Good 89.3% |
| Laotians | 61.8 /100 | #160 | Good 89.3% |
| Brazilians | 61.2 /100 | #161 | Good 89.3% |
| Bermudans | 61.1 /100 | #162 | Good 89.3% |
| Cree | 61.1 /100 | #163 | Good 89.3% |
| Immigrants | Nepal | 61.1 /100 | #164 | Good 89.3% |
| Immigrants | Asia | 59.8 /100 | #165 | Average 89.3% |
| Immigrants | Albania | 59.4 /100 | #166 | Average 89.3% |
| Immigrants | Hong Kong | 58.6 /100 | #167 | Average 89.3% |
| Delaware | 55.8 /100 | #168 | Average 89.2% |
| Iroquois | 55.1 /100 | #169 | Average 89.2% |
| Immigrants | Morocco | 53.3 /100 | #170 | Average 89.2% |
Demographics Similar to Immigrants from Vietnam by High School Diploma
In terms of high school diploma, the demographic groups most similar to Immigrants from Vietnam are Ute (86.2%, a difference of 0.0%), Immigrants from St. Vincent and the Grenadines (86.2%, a difference of 0.040%), Immigrants from West Indies (86.2%, a difference of 0.060%), Yup'ik (86.1%, a difference of 0.11%), and Fijian (86.0%, a difference of 0.18%).
| Demographics | Rating | Rank | High School Diploma |
| Indonesians | 0.0 /100 | #281 | Tragic 86.5% |
| Dutch West Indians | 0.0 /100 | #282 | Tragic 86.5% |
| Immigrants | Barbados | 0.0 /100 | #283 | Tragic 86.4% |
| Paiute | 0.0 /100 | #284 | Tragic 86.4% |
| Immigrants | West Indies | 0.0 /100 | #285 | Tragic 86.2% |
| Immigrants | St. Vincent and the Grenadines | 0.0 /100 | #286 | Tragic 86.2% |
| Ute | 0.0 /100 | #287 | Tragic 86.2% |
| Immigrants | Vietnam | 0.0 /100 | #288 | Tragic 86.2% |
| Yup'ik | 0.0 /100 | #289 | Tragic 86.1% |
| Fijians | 0.0 /100 | #290 | Tragic 86.0% |
| Haitians | 0.0 /100 | #291 | Tragic 85.9% |
| Japanese | 0.0 /100 | #292 | Tragic 85.9% |
| British West Indians | 0.0 /100 | #293 | Tragic 85.9% |
| Immigrants | Fiji | 0.0 /100 | #294 | Tragic 85.8% |
| Immigrants | Immigrants | 0.0 /100 | #295 | Tragic 85.8% |