Immigrants from Liberia vs Immigrants from Ecuador High School Diploma
COMPARE
Immigrants from Liberia
Immigrants from Ecuador
High School Diploma
High School Diploma Comparison
Immigrants from Liberia
Immigrants from Ecuador
88.2%
HIGH SCHOOL DIPLOMA
5.5/ 100
METRIC RATING
227th/ 347
METRIC RANK
84.8%
HIGH SCHOOL DIPLOMA
0.0/ 100
METRIC RATING
313th/ 347
METRIC RANK
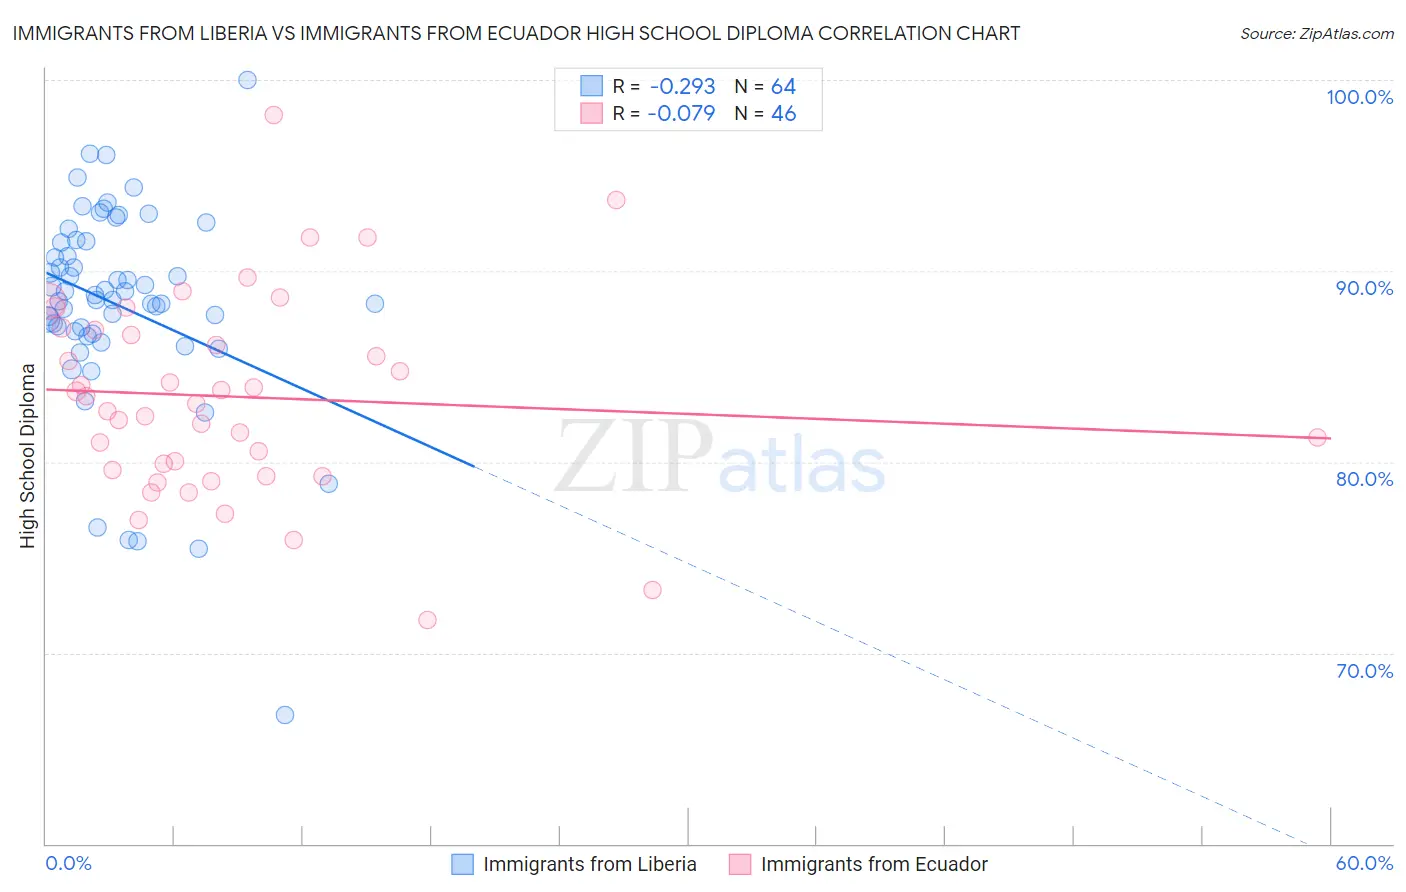
Immigrants from Liberia vs Immigrants from Ecuador High School Diploma Correlation Chart
The statistical analysis conducted on geographies consisting of 135,293,967 people shows a weak negative correlation between the proportion of Immigrants from Liberia and percentage of population with at least high school diploma education in the United States with a correlation coefficient (R) of -0.293 and weighted average of 88.2%. Similarly, the statistical analysis conducted on geographies consisting of 270,907,929 people shows a slight negative correlation between the proportion of Immigrants from Ecuador and percentage of population with at least high school diploma education in the United States with a correlation coefficient (R) of -0.079 and weighted average of 84.8%, a difference of 4.0%.
High School Diploma Correlation Summary
| Measurement | Immigrants from Liberia | Immigrants from Ecuador |
| Minimum | 66.8% | 71.7% |
| Maximum | 100.0% | 98.2% |
| Range | 33.2% | 26.5% |
| Mean | 88.2% | 83.4% |
| Median | 88.6% | 83.3% |
| Interquartile 25% (IQ1) | 86.8% | 79.6% |
| Interquartile 75% (IQ3) | 91.5% | 86.9% |
| Interquartile Range (IQR) | 4.7% | 7.3% |
| Standard Deviation (Sample) | 5.5% | 5.3% |
| Standard Deviation (Population) | 5.4% | 5.2% |
Similar Demographics by High School Diploma
Demographics Similar to Immigrants from Liberia by High School Diploma
In terms of high school diploma, the demographic groups most similar to Immigrants from Liberia are Uruguayan (88.2%, a difference of 0.010%), Kiowa (88.2%, a difference of 0.010%), Nigerian (88.2%, a difference of 0.020%), Creek (88.3%, a difference of 0.090%), and Shoshone (88.3%, a difference of 0.10%).
| Demographics | Rating | Rank | High School Diploma |
| Tongans | 9.5 /100 | #220 | Tragic 88.4% |
| Immigrants | Afghanistan | 8.6 /100 | #221 | Tragic 88.3% |
| Colville | 7.8 /100 | #222 | Tragic 88.3% |
| Immigrants | Zaire | 7.6 /100 | #223 | Tragic 88.3% |
| Shoshone | 7.0 /100 | #224 | Tragic 88.3% |
| Creek | 6.9 /100 | #225 | Tragic 88.3% |
| Uruguayans | 5.6 /100 | #226 | Tragic 88.2% |
| Immigrants | Liberia | 5.5 /100 | #227 | Tragic 88.2% |
| Kiowa | 5.3 /100 | #228 | Tragic 88.2% |
| Nigerians | 5.2 /100 | #229 | Tragic 88.2% |
| Blackfeet | 4.2 /100 | #230 | Tragic 88.1% |
| Colombians | 3.8 /100 | #231 | Tragic 88.1% |
| Immigrants | Middle Africa | 3.4 /100 | #232 | Tragic 88.0% |
| Immigrants | Panama | 3.1 /100 | #233 | Tragic 88.0% |
| Immigrants | Thailand | 3.1 /100 | #234 | Tragic 88.0% |
Demographics Similar to Immigrants from Ecuador by High School Diploma
In terms of high school diploma, the demographic groups most similar to Immigrants from Ecuador are Yaqui (84.7%, a difference of 0.11%), Puerto Rican (84.7%, a difference of 0.20%), Cape Verdean (85.1%, a difference of 0.26%), Ecuadorian (85.1%, a difference of 0.31%), and Apache (85.1%, a difference of 0.32%).
| Demographics | Rating | Rank | High School Diploma |
| Immigrants | Guyana | 0.0 /100 | #306 | Tragic 85.3% |
| Navajo | 0.0 /100 | #307 | Tragic 85.2% |
| Immigrants | Armenia | 0.0 /100 | #308 | Tragic 85.2% |
| Immigrants | Dominica | 0.0 /100 | #309 | Tragic 85.2% |
| Apache | 0.0 /100 | #310 | Tragic 85.1% |
| Ecuadorians | 0.0 /100 | #311 | Tragic 85.1% |
| Cape Verdeans | 0.0 /100 | #312 | Tragic 85.1% |
| Immigrants | Ecuador | 0.0 /100 | #313 | Tragic 84.8% |
| Yaqui | 0.0 /100 | #314 | Tragic 84.7% |
| Puerto Ricans | 0.0 /100 | #315 | Tragic 84.7% |
| Belizeans | 0.0 /100 | #316 | Tragic 84.3% |
| Immigrants | Caribbean | 0.0 /100 | #317 | Tragic 84.3% |
| Immigrants | Belize | 0.0 /100 | #318 | Tragic 84.2% |
| Central American Indians | 0.0 /100 | #319 | Tragic 84.2% |
| Nicaraguans | 0.0 /100 | #320 | Tragic 84.1% |