Spaniard vs Immigrants from Ecuador High School Diploma
COMPARE
Spaniard
Immigrants from Ecuador
High School Diploma
High School Diploma Comparison
Spaniards
Immigrants from Ecuador
89.1%
HIGH SCHOOL DIPLOMA
43.4/ 100
METRIC RATING
182nd/ 347
METRIC RANK
84.8%
HIGH SCHOOL DIPLOMA
0.0/ 100
METRIC RATING
313th/ 347
METRIC RANK
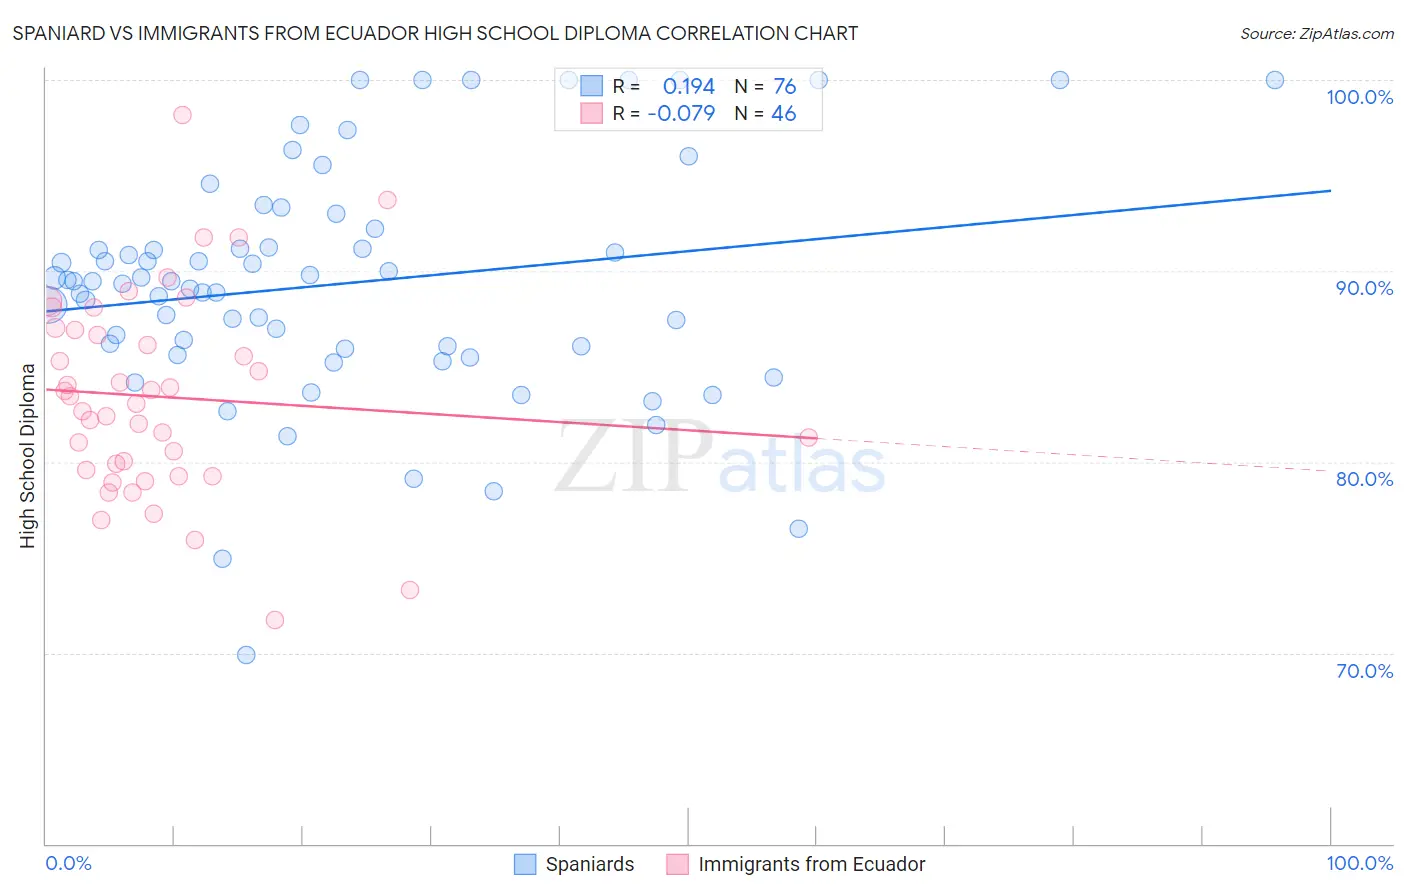
Spaniard vs Immigrants from Ecuador High School Diploma Correlation Chart
The statistical analysis conducted on geographies consisting of 443,545,794 people shows a poor positive correlation between the proportion of Spaniards and percentage of population with at least high school diploma education in the United States with a correlation coefficient (R) of 0.194 and weighted average of 89.1%. Similarly, the statistical analysis conducted on geographies consisting of 270,907,929 people shows a slight negative correlation between the proportion of Immigrants from Ecuador and percentage of population with at least high school diploma education in the United States with a correlation coefficient (R) of -0.079 and weighted average of 84.8%, a difference of 5.0%.
High School Diploma Correlation Summary
| Measurement | Spaniard | Immigrants from Ecuador |
| Minimum | 69.9% | 71.7% |
| Maximum | 100.0% | 98.2% |
| Range | 30.1% | 26.5% |
| Mean | 89.3% | 83.4% |
| Median | 89.5% | 83.3% |
| Interquartile 25% (IQ1) | 86.0% | 79.6% |
| Interquartile 75% (IQ3) | 91.7% | 86.9% |
| Interquartile Range (IQR) | 5.7% | 7.3% |
| Standard Deviation (Sample) | 6.2% | 5.3% |
| Standard Deviation (Population) | 6.1% | 5.2% |
Similar Demographics by High School Diploma
Demographics Similar to Spaniards by High School Diploma
In terms of high school diploma, the demographic groups most similar to Spaniards are Venezuelan (89.1%, a difference of 0.0%), Potawatomi (89.0%, a difference of 0.010%), Bolivian (89.1%, a difference of 0.030%), American (89.1%, a difference of 0.060%), and Immigrants from Syria (89.0%, a difference of 0.060%).
| Demographics | Rating | Rank | High School Diploma |
| Immigrants | Western Asia | 49.0 /100 | #175 | Average 89.1% |
| Osage | 48.9 /100 | #176 | Average 89.1% |
| Sudanese | 48.5 /100 | #177 | Average 89.1% |
| Sierra Leoneans | 48.4 /100 | #178 | Average 89.1% |
| Americans | 47.2 /100 | #179 | Average 89.1% |
| Bolivians | 45.2 /100 | #180 | Average 89.1% |
| Venezuelans | 43.6 /100 | #181 | Average 89.1% |
| Spaniards | 43.4 /100 | #182 | Average 89.1% |
| Potawatomi | 42.5 /100 | #183 | Average 89.0% |
| Immigrants | Syria | 39.2 /100 | #184 | Fair 89.0% |
| Ethiopians | 37.0 /100 | #185 | Fair 89.0% |
| Immigrants | Eastern Africa | 35.8 /100 | #186 | Fair 88.9% |
| Guamanians/Chamorros | 35.5 /100 | #187 | Fair 88.9% |
| Immigrants | Sudan | 33.4 /100 | #188 | Fair 88.9% |
| Immigrants | Uganda | 32.6 /100 | #189 | Fair 88.9% |
Demographics Similar to Immigrants from Ecuador by High School Diploma
In terms of high school diploma, the demographic groups most similar to Immigrants from Ecuador are Yaqui (84.7%, a difference of 0.11%), Puerto Rican (84.7%, a difference of 0.20%), Cape Verdean (85.1%, a difference of 0.26%), Ecuadorian (85.1%, a difference of 0.31%), and Apache (85.1%, a difference of 0.32%).
| Demographics | Rating | Rank | High School Diploma |
| Immigrants | Guyana | 0.0 /100 | #306 | Tragic 85.3% |
| Navajo | 0.0 /100 | #307 | Tragic 85.2% |
| Immigrants | Armenia | 0.0 /100 | #308 | Tragic 85.2% |
| Immigrants | Dominica | 0.0 /100 | #309 | Tragic 85.2% |
| Apache | 0.0 /100 | #310 | Tragic 85.1% |
| Ecuadorians | 0.0 /100 | #311 | Tragic 85.1% |
| Cape Verdeans | 0.0 /100 | #312 | Tragic 85.1% |
| Immigrants | Ecuador | 0.0 /100 | #313 | Tragic 84.8% |
| Yaqui | 0.0 /100 | #314 | Tragic 84.7% |
| Puerto Ricans | 0.0 /100 | #315 | Tragic 84.7% |
| Belizeans | 0.0 /100 | #316 | Tragic 84.3% |
| Immigrants | Caribbean | 0.0 /100 | #317 | Tragic 84.3% |
| Immigrants | Belize | 0.0 /100 | #318 | Tragic 84.2% |
| Central American Indians | 0.0 /100 | #319 | Tragic 84.2% |
| Nicaraguans | 0.0 /100 | #320 | Tragic 84.1% |