Cree vs Immigrants from Belize Master's Degree
COMPARE
Cree
Immigrants from Belize
Master's Degree
Master's Degree Comparison
Cree
Immigrants from Belize
12.8%
MASTER'S DEGREE
1.3/ 100
METRIC RATING
249th/ 347
METRIC RANK
12.1%
MASTER'S DEGREE
0.2/ 100
METRIC RATING
279th/ 347
METRIC RANK
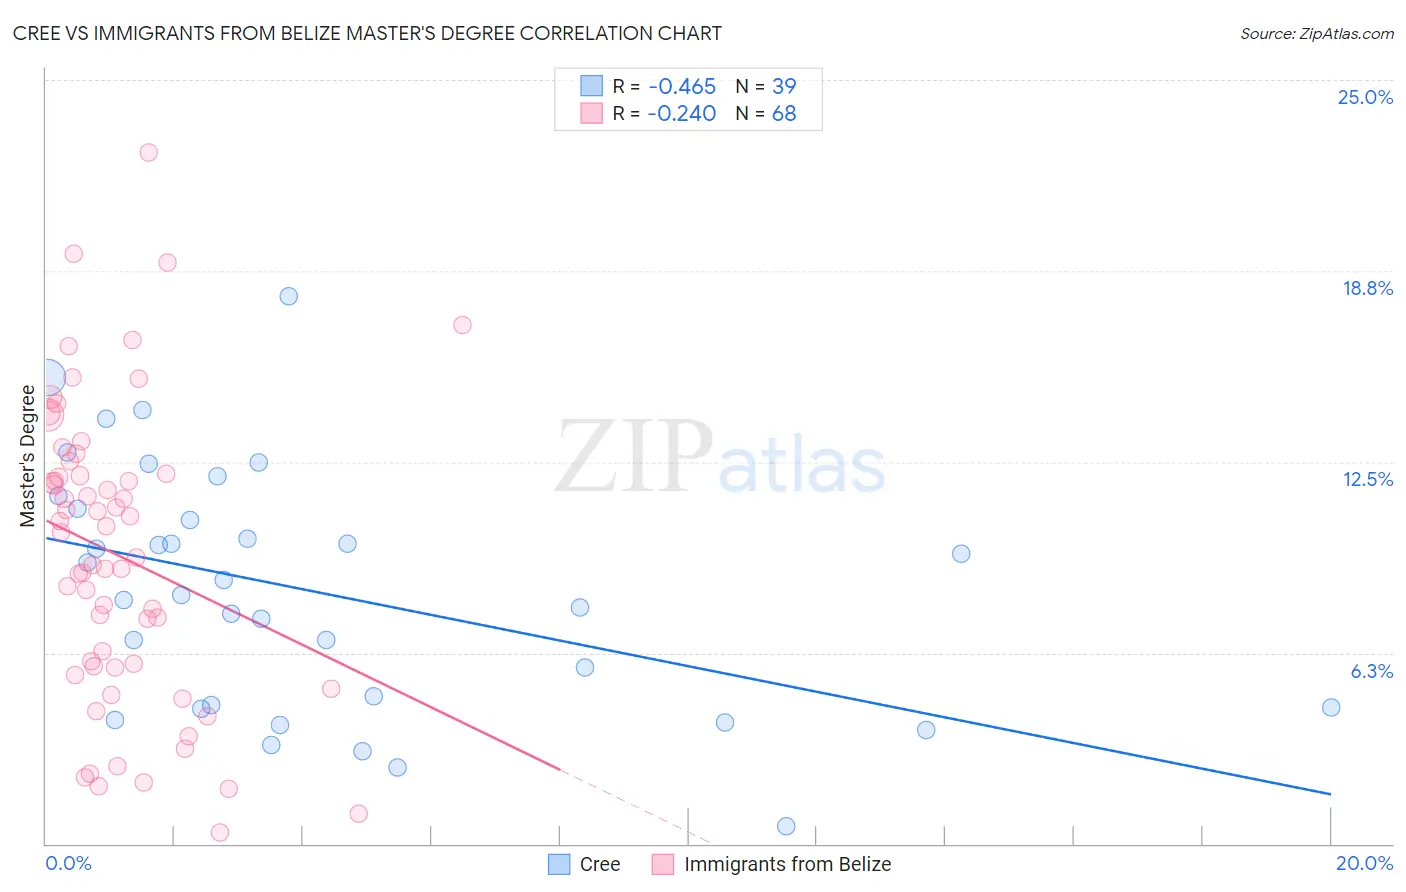
Cree vs Immigrants from Belize Master's Degree Correlation Chart
The statistical analysis conducted on geographies consisting of 76,203,743 people shows a moderate negative correlation between the proportion of Cree and percentage of population with at least master's degree education in the United States with a correlation coefficient (R) of -0.465 and weighted average of 12.8%. Similarly, the statistical analysis conducted on geographies consisting of 130,312,912 people shows a weak negative correlation between the proportion of Immigrants from Belize and percentage of population with at least master's degree education in the United States with a correlation coefficient (R) of -0.240 and weighted average of 12.1%, a difference of 6.5%.
Master's Degree Correlation Summary
| Measurement | Cree | Immigrants from Belize |
| Minimum | 0.59% | 0.37% |
| Maximum | 17.9% | 22.6% |
| Range | 17.3% | 22.3% |
| Mean | 8.2% | 9.4% |
| Median | 8.1% | 9.8% |
| Interquartile 25% (IQ1) | 4.4% | 5.8% |
| Interquartile 75% (IQ3) | 11.0% | 12.1% |
| Interquartile Range (IQR) | 6.5% | 6.3% |
| Standard Deviation (Sample) | 4.0% | 4.8% |
| Standard Deviation (Population) | 3.9% | 4.8% |
Similar Demographics by Master's Degree
Demographics Similar to Cree by Master's Degree
In terms of master's degree, the demographic groups most similar to Cree are Liberian (12.8%, a difference of 0.010%), Tlingit-Haida (12.8%, a difference of 0.040%), African (12.9%, a difference of 0.31%), Iroquois (12.9%, a difference of 0.40%), and Immigrants from Cambodia (12.9%, a difference of 0.43%).
| Demographics | Rating | Rank | Master's Degree |
| Spanish Americans | 1.9 /100 | #242 | Tragic 13.0% |
| Immigrants | Jamaica | 1.9 /100 | #243 | Tragic 13.0% |
| Delaware | 1.7 /100 | #244 | Tragic 13.0% |
| Immigrants | Bahamas | 1.4 /100 | #245 | Tragic 12.9% |
| Immigrants | Cambodia | 1.4 /100 | #246 | Tragic 12.9% |
| Iroquois | 1.4 /100 | #247 | Tragic 12.9% |
| Africans | 1.4 /100 | #248 | Tragic 12.9% |
| Cree | 1.3 /100 | #249 | Tragic 12.8% |
| Liberians | 1.3 /100 | #250 | Tragic 12.8% |
| Tlingit-Haida | 1.3 /100 | #251 | Tragic 12.8% |
| French American Indians | 1.0 /100 | #252 | Tragic 12.7% |
| Immigrants | Dominica | 0.8 /100 | #253 | Tragic 12.6% |
| Indonesians | 0.8 /100 | #254 | Tragic 12.6% |
| Immigrants | Congo | 0.8 /100 | #255 | Tragic 12.6% |
| Immigrants | Portugal | 0.8 /100 | #256 | Tragic 12.6% |
Demographics Similar to Immigrants from Belize by Master's Degree
In terms of master's degree, the demographic groups most similar to Immigrants from Belize are Immigrants from Dominican Republic (12.1%, a difference of 0.060%), Immigrants from Caribbean (12.1%, a difference of 0.080%), Potawatomi (12.1%, a difference of 0.080%), Black/African American (12.1%, a difference of 0.090%), and Cuban (12.1%, a difference of 0.15%).
| Demographics | Rating | Rank | Master's Degree |
| Comanche | 0.3 /100 | #272 | Tragic 12.1% |
| Blackfeet | 0.3 /100 | #273 | Tragic 12.1% |
| Cape Verdeans | 0.3 /100 | #274 | Tragic 12.1% |
| Cubans | 0.3 /100 | #275 | Tragic 12.1% |
| Blacks/African Americans | 0.3 /100 | #276 | Tragic 12.1% |
| Immigrants | Caribbean | 0.3 /100 | #277 | Tragic 12.1% |
| Potawatomi | 0.3 /100 | #278 | Tragic 12.1% |
| Immigrants | Belize | 0.2 /100 | #279 | Tragic 12.1% |
| Immigrants | Dominican Republic | 0.2 /100 | #280 | Tragic 12.1% |
| Malaysians | 0.2 /100 | #281 | Tragic 12.0% |
| Immigrants | El Salvador | 0.2 /100 | #282 | Tragic 12.0% |
| Hondurans | 0.2 /100 | #283 | Tragic 11.9% |
| Ottawa | 0.2 /100 | #284 | Tragic 11.9% |
| Immigrants | Nicaragua | 0.2 /100 | #285 | Tragic 11.8% |
| Aleuts | 0.1 /100 | #286 | Tragic 11.8% |