Greek vs Immigrants from Belize Master's Degree
COMPARE
Greek
Immigrants from Belize
Master's Degree
Master's Degree Comparison
Greeks
Immigrants from Belize
17.5%
MASTER'S DEGREE
99.5/ 100
METRIC RATING
82nd/ 347
METRIC RANK
12.1%
MASTER'S DEGREE
0.2/ 100
METRIC RATING
279th/ 347
METRIC RANK
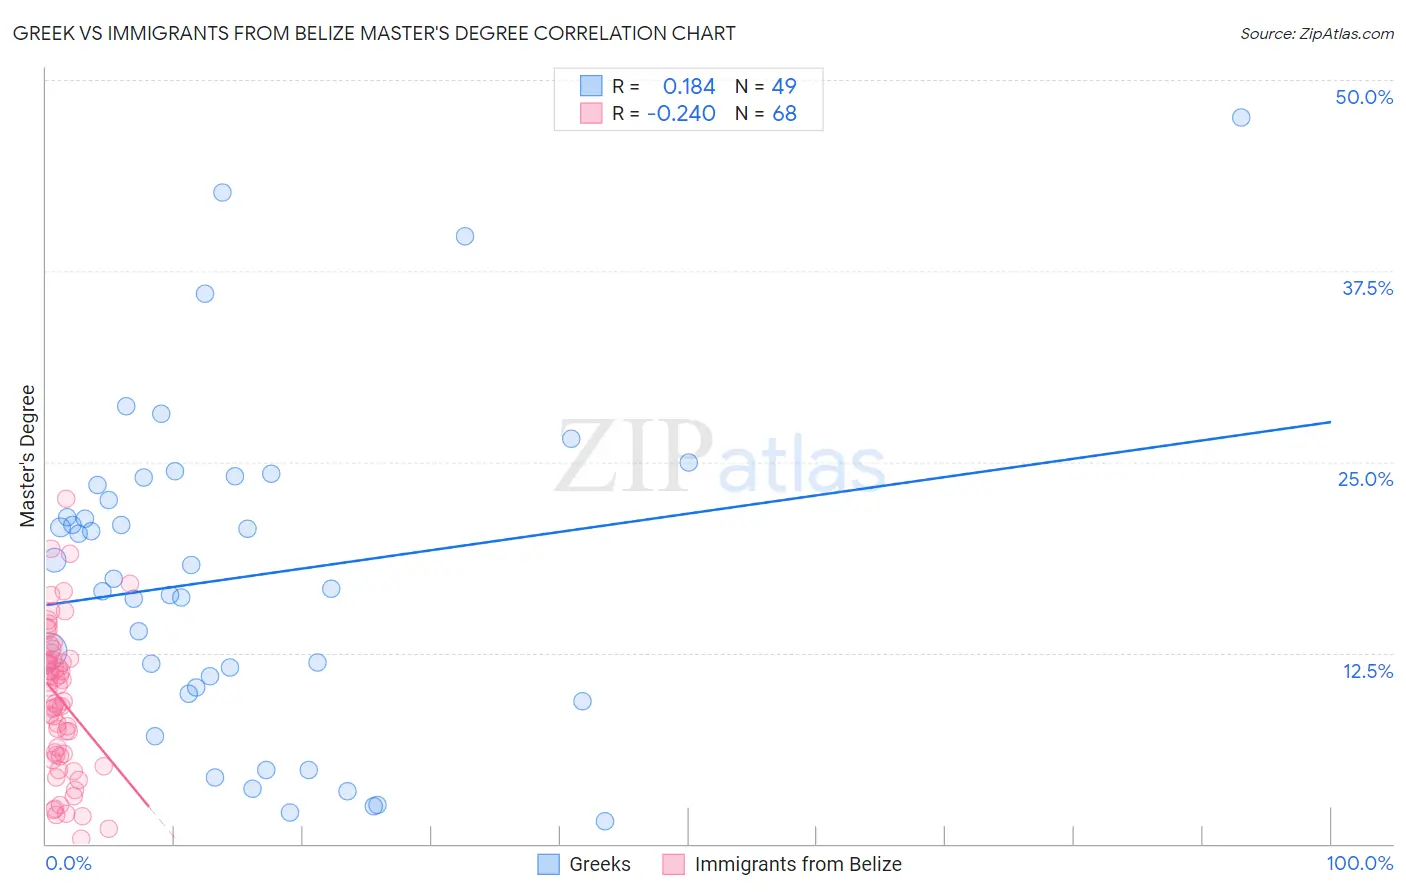
Greek vs Immigrants from Belize Master's Degree Correlation Chart
The statistical analysis conducted on geographies consisting of 482,528,653 people shows a poor positive correlation between the proportion of Greeks and percentage of population with at least master's degree education in the United States with a correlation coefficient (R) of 0.184 and weighted average of 17.5%. Similarly, the statistical analysis conducted on geographies consisting of 130,312,912 people shows a weak negative correlation between the proportion of Immigrants from Belize and percentage of population with at least master's degree education in the United States with a correlation coefficient (R) of -0.240 and weighted average of 12.1%, a difference of 44.7%.
Master's Degree Correlation Summary
| Measurement | Greek | Immigrants from Belize |
| Minimum | 1.5% | 0.37% |
| Maximum | 47.6% | 22.6% |
| Range | 46.1% | 22.3% |
| Mean | 17.5% | 9.4% |
| Median | 17.3% | 9.8% |
| Interquartile 25% (IQ1) | 10.0% | 5.8% |
| Interquartile 75% (IQ3) | 23.7% | 12.1% |
| Interquartile Range (IQR) | 13.7% | 6.3% |
| Standard Deviation (Sample) | 10.6% | 4.8% |
| Standard Deviation (Population) | 10.5% | 4.8% |
Similar Demographics by Master's Degree
Demographics Similar to Greeks by Master's Degree
In terms of master's degree, the demographic groups most similar to Greeks are Immigrants from Western Asia (17.5%, a difference of 0.050%), Immigrants from Zimbabwe (17.4%, a difference of 0.050%), Carpatho Rusyn (17.5%, a difference of 0.35%), Immigrants from Scotland (17.4%, a difference of 0.39%), and Immigrants from Lebanon (17.5%, a difference of 0.40%).
| Demographics | Rating | Rank | Master's Degree |
| Egyptians | 99.6 /100 | #75 | Exceptional 17.6% |
| Immigrants | Indonesia | 99.6 /100 | #76 | Exceptional 17.6% |
| Immigrants | Eastern Europe | 99.6 /100 | #77 | Exceptional 17.6% |
| Immigrants | Hungary | 99.6 /100 | #78 | Exceptional 17.5% |
| Immigrants | Lebanon | 99.6 /100 | #79 | Exceptional 17.5% |
| Carpatho Rusyns | 99.6 /100 | #80 | Exceptional 17.5% |
| Immigrants | Western Asia | 99.5 /100 | #81 | Exceptional 17.5% |
| Greeks | 99.5 /100 | #82 | Exceptional 17.5% |
| Immigrants | Zimbabwe | 99.5 /100 | #83 | Exceptional 17.4% |
| Immigrants | Scotland | 99.4 /100 | #84 | Exceptional 17.4% |
| Immigrants | Brazil | 99.4 /100 | #85 | Exceptional 17.4% |
| Immigrants | Croatia | 99.3 /100 | #86 | Exceptional 17.3% |
| Maltese | 99.3 /100 | #87 | Exceptional 17.3% |
| Immigrants | Canada | 99.2 /100 | #88 | Exceptional 17.2% |
| Bhutanese | 99.1 /100 | #89 | Exceptional 17.2% |
Demographics Similar to Immigrants from Belize by Master's Degree
In terms of master's degree, the demographic groups most similar to Immigrants from Belize are Immigrants from Dominican Republic (12.1%, a difference of 0.060%), Immigrants from Caribbean (12.1%, a difference of 0.080%), Potawatomi (12.1%, a difference of 0.080%), Black/African American (12.1%, a difference of 0.090%), and Cuban (12.1%, a difference of 0.15%).
| Demographics | Rating | Rank | Master's Degree |
| Comanche | 0.3 /100 | #272 | Tragic 12.1% |
| Blackfeet | 0.3 /100 | #273 | Tragic 12.1% |
| Cape Verdeans | 0.3 /100 | #274 | Tragic 12.1% |
| Cubans | 0.3 /100 | #275 | Tragic 12.1% |
| Blacks/African Americans | 0.3 /100 | #276 | Tragic 12.1% |
| Immigrants | Caribbean | 0.3 /100 | #277 | Tragic 12.1% |
| Potawatomi | 0.3 /100 | #278 | Tragic 12.1% |
| Immigrants | Belize | 0.2 /100 | #279 | Tragic 12.1% |
| Immigrants | Dominican Republic | 0.2 /100 | #280 | Tragic 12.1% |
| Malaysians | 0.2 /100 | #281 | Tragic 12.0% |
| Immigrants | El Salvador | 0.2 /100 | #282 | Tragic 12.0% |
| Hondurans | 0.2 /100 | #283 | Tragic 11.9% |
| Ottawa | 0.2 /100 | #284 | Tragic 11.9% |
| Immigrants | Nicaragua | 0.2 /100 | #285 | Tragic 11.8% |
| Aleuts | 0.1 /100 | #286 | Tragic 11.8% |