Macedonian vs Immigrants from Belize Master's Degree
COMPARE
Macedonian
Immigrants from Belize
Master's Degree
Master's Degree Comparison
Macedonians
Immigrants from Belize
16.7%
MASTER'S DEGREE
97.7/ 100
METRIC RATING
112th/ 347
METRIC RANK
12.1%
MASTER'S DEGREE
0.2/ 100
METRIC RATING
279th/ 347
METRIC RANK
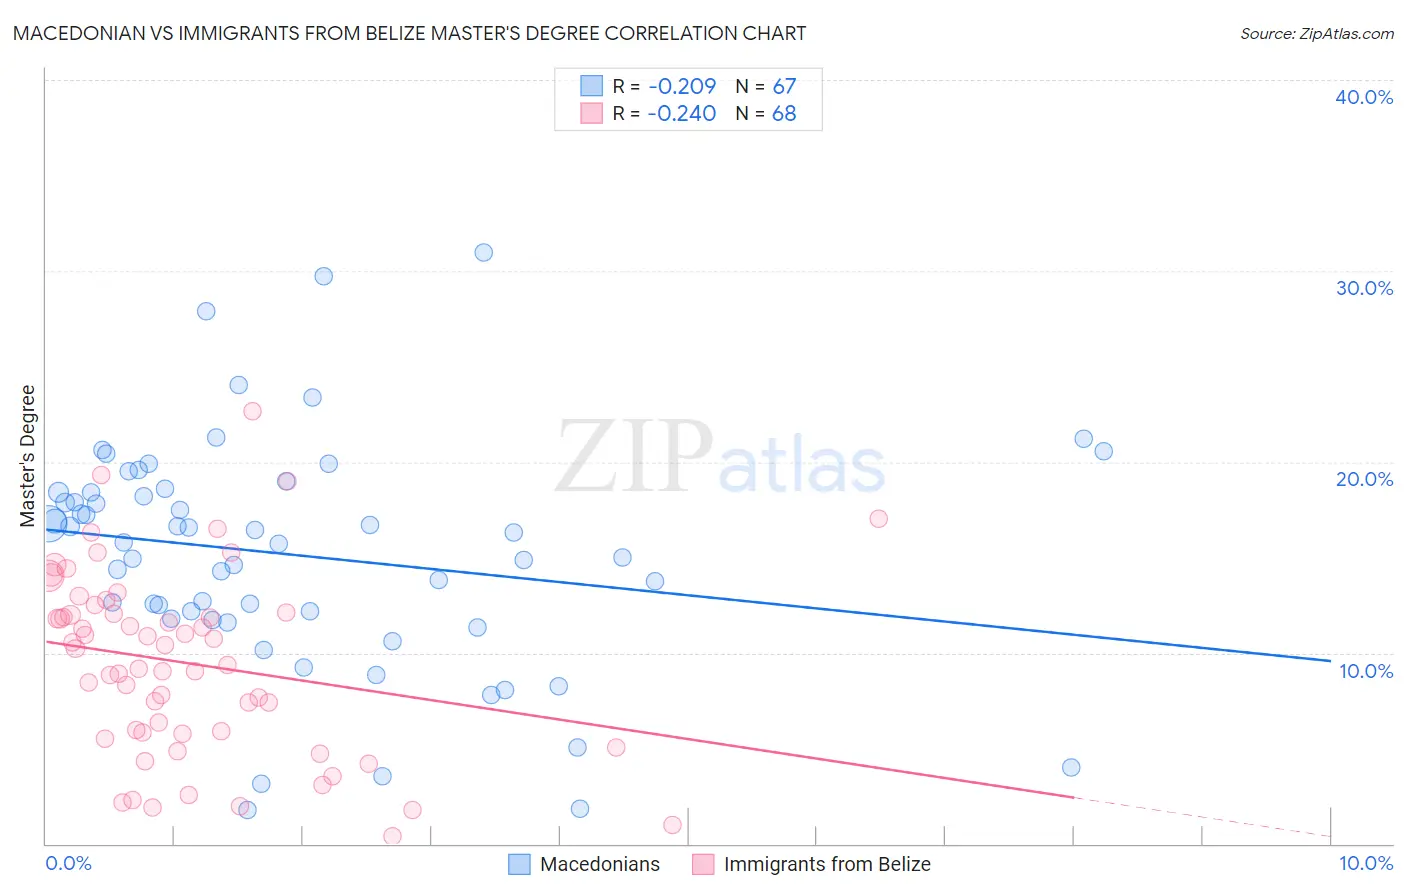
Macedonian vs Immigrants from Belize Master's Degree Correlation Chart
The statistical analysis conducted on geographies consisting of 132,580,615 people shows a weak negative correlation between the proportion of Macedonians and percentage of population with at least master's degree education in the United States with a correlation coefficient (R) of -0.209 and weighted average of 16.7%. Similarly, the statistical analysis conducted on geographies consisting of 130,312,912 people shows a weak negative correlation between the proportion of Immigrants from Belize and percentage of population with at least master's degree education in the United States with a correlation coefficient (R) of -0.240 and weighted average of 12.1%, a difference of 38.5%.
Master's Degree Correlation Summary
| Measurement | Macedonian | Immigrants from Belize |
| Minimum | 1.8% | 0.37% |
| Maximum | 31.0% | 22.6% |
| Range | 29.2% | 22.3% |
| Mean | 15.1% | 9.4% |
| Median | 15.8% | 9.8% |
| Interquartile 25% (IQ1) | 11.8% | 5.8% |
| Interquartile 75% (IQ3) | 18.4% | 12.1% |
| Interquartile Range (IQR) | 6.6% | 6.3% |
| Standard Deviation (Sample) | 6.0% | 4.8% |
| Standard Deviation (Population) | 5.9% | 4.8% |
Similar Demographics by Master's Degree
Demographics Similar to Macedonians by Master's Degree
In terms of master's degree, the demographic groups most similar to Macedonians are Arab (16.7%, a difference of 0.010%), Northern European (16.7%, a difference of 0.080%), Austrian (16.7%, a difference of 0.14%), Immigrants from Uganda (16.6%, a difference of 0.38%), and Immigrants from Chile (16.8%, a difference of 0.41%).
| Demographics | Rating | Rank | Master's Degree |
| Syrians | 98.3 /100 | #105 | Exceptional 16.8% |
| Immigrants | Albania | 98.1 /100 | #106 | Exceptional 16.8% |
| Armenians | 98.0 /100 | #107 | Exceptional 16.8% |
| Sierra Leoneans | 98.0 /100 | #108 | Exceptional 16.8% |
| Moroccans | 98.0 /100 | #109 | Exceptional 16.8% |
| Immigrants | Chile | 98.0 /100 | #110 | Exceptional 16.8% |
| Austrians | 97.8 /100 | #111 | Exceptional 16.7% |
| Macedonians | 97.7 /100 | #112 | Exceptional 16.7% |
| Arabs | 97.7 /100 | #113 | Exceptional 16.7% |
| Northern Europeans | 97.6 /100 | #114 | Exceptional 16.7% |
| Immigrants | Uganda | 97.3 /100 | #115 | Exceptional 16.6% |
| Immigrants | Southern Europe | 97.2 /100 | #116 | Exceptional 16.6% |
| Immigrants | Moldova | 97.2 /100 | #117 | Exceptional 16.6% |
| Brazilians | 96.8 /100 | #118 | Exceptional 16.5% |
| Jordanians | 96.5 /100 | #119 | Exceptional 16.5% |
Demographics Similar to Immigrants from Belize by Master's Degree
In terms of master's degree, the demographic groups most similar to Immigrants from Belize are Immigrants from Dominican Republic (12.1%, a difference of 0.060%), Immigrants from Caribbean (12.1%, a difference of 0.080%), Potawatomi (12.1%, a difference of 0.080%), Black/African American (12.1%, a difference of 0.090%), and Cuban (12.1%, a difference of 0.15%).
| Demographics | Rating | Rank | Master's Degree |
| Comanche | 0.3 /100 | #272 | Tragic 12.1% |
| Blackfeet | 0.3 /100 | #273 | Tragic 12.1% |
| Cape Verdeans | 0.3 /100 | #274 | Tragic 12.1% |
| Cubans | 0.3 /100 | #275 | Tragic 12.1% |
| Blacks/African Americans | 0.3 /100 | #276 | Tragic 12.1% |
| Immigrants | Caribbean | 0.3 /100 | #277 | Tragic 12.1% |
| Potawatomi | 0.3 /100 | #278 | Tragic 12.1% |
| Immigrants | Belize | 0.2 /100 | #279 | Tragic 12.1% |
| Immigrants | Dominican Republic | 0.2 /100 | #280 | Tragic 12.1% |
| Malaysians | 0.2 /100 | #281 | Tragic 12.0% |
| Immigrants | El Salvador | 0.2 /100 | #282 | Tragic 12.0% |
| Hondurans | 0.2 /100 | #283 | Tragic 11.9% |
| Ottawa | 0.2 /100 | #284 | Tragic 11.9% |
| Immigrants | Nicaragua | 0.2 /100 | #285 | Tragic 11.8% |
| Aleuts | 0.1 /100 | #286 | Tragic 11.8% |