Cree vs Immigrants from Eastern Europe Master's Degree
COMPARE
Cree
Immigrants from Eastern Europe
Master's Degree
Master's Degree Comparison
Cree
Immigrants from Eastern Europe
12.8%
MASTER'S DEGREE
1.3/ 100
METRIC RATING
249th/ 347
METRIC RANK
17.6%
MASTER'S DEGREE
99.6/ 100
METRIC RATING
77th/ 347
METRIC RANK
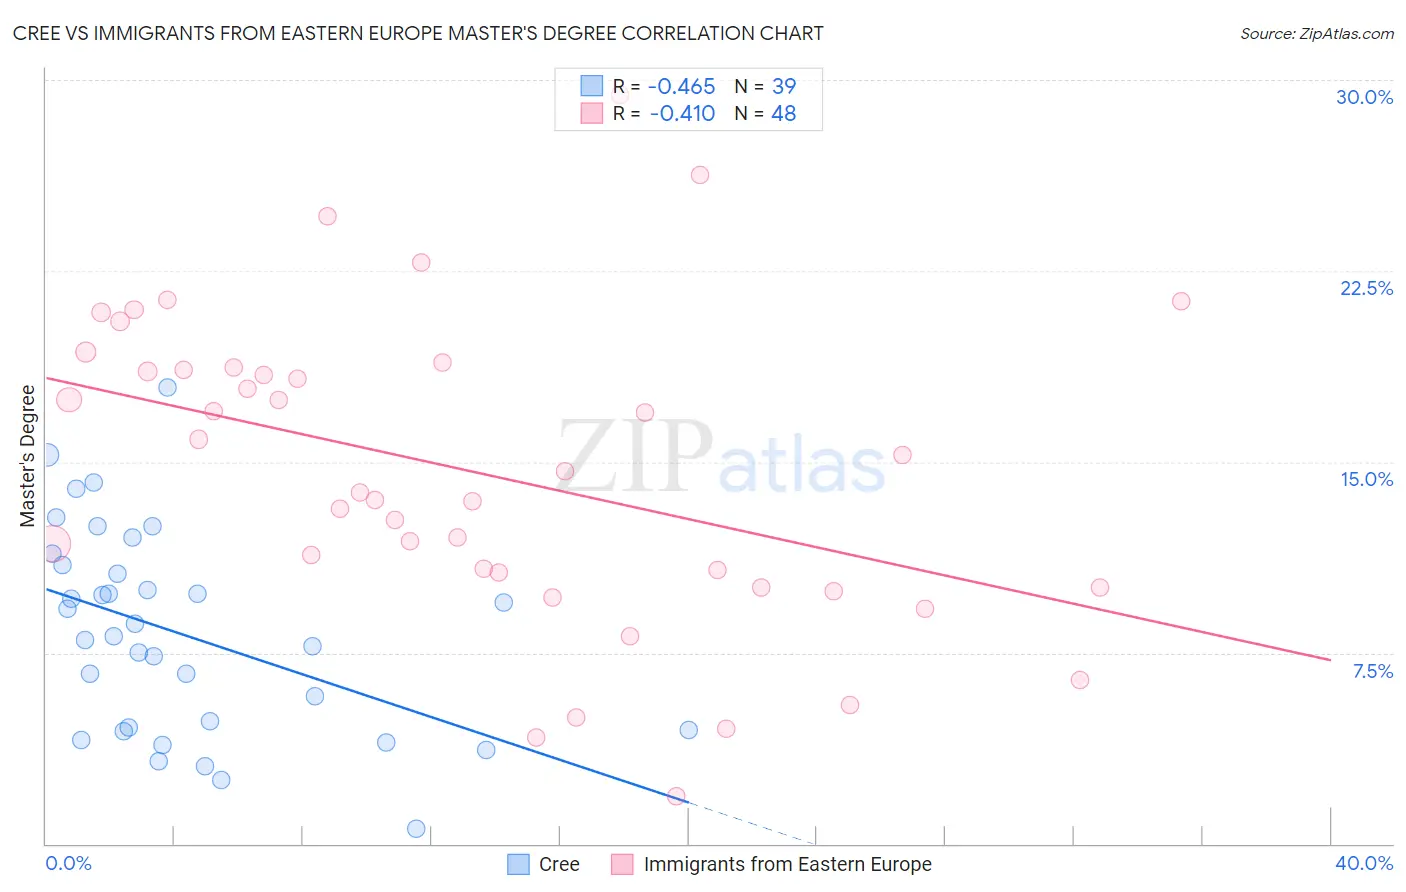
Cree vs Immigrants from Eastern Europe Master's Degree Correlation Chart
The statistical analysis conducted on geographies consisting of 76,203,743 people shows a moderate negative correlation between the proportion of Cree and percentage of population with at least master's degree education in the United States with a correlation coefficient (R) of -0.465 and weighted average of 12.8%. Similarly, the statistical analysis conducted on geographies consisting of 475,675,082 people shows a moderate negative correlation between the proportion of Immigrants from Eastern Europe and percentage of population with at least master's degree education in the United States with a correlation coefficient (R) of -0.410 and weighted average of 17.6%, a difference of 36.8%.
Master's Degree Correlation Summary
| Measurement | Cree | Immigrants from Eastern Europe |
| Minimum | 0.59% | 1.9% |
| Maximum | 17.9% | 29.4% |
| Range | 17.3% | 27.5% |
| Mean | 8.2% | 14.6% |
| Median | 8.1% | 14.2% |
| Interquartile 25% (IQ1) | 4.4% | 10.3% |
| Interquartile 75% (IQ3) | 11.0% | 18.7% |
| Interquartile Range (IQR) | 6.5% | 8.3% |
| Standard Deviation (Sample) | 4.0% | 6.1% |
| Standard Deviation (Population) | 3.9% | 6.0% |
Similar Demographics by Master's Degree
Demographics Similar to Cree by Master's Degree
In terms of master's degree, the demographic groups most similar to Cree are Liberian (12.8%, a difference of 0.010%), Tlingit-Haida (12.8%, a difference of 0.040%), African (12.9%, a difference of 0.31%), Iroquois (12.9%, a difference of 0.40%), and Immigrants from Cambodia (12.9%, a difference of 0.43%).
| Demographics | Rating | Rank | Master's Degree |
| Spanish Americans | 1.9 /100 | #242 | Tragic 13.0% |
| Immigrants | Jamaica | 1.9 /100 | #243 | Tragic 13.0% |
| Delaware | 1.7 /100 | #244 | Tragic 13.0% |
| Immigrants | Bahamas | 1.4 /100 | #245 | Tragic 12.9% |
| Immigrants | Cambodia | 1.4 /100 | #246 | Tragic 12.9% |
| Iroquois | 1.4 /100 | #247 | Tragic 12.9% |
| Africans | 1.4 /100 | #248 | Tragic 12.9% |
| Cree | 1.3 /100 | #249 | Tragic 12.8% |
| Liberians | 1.3 /100 | #250 | Tragic 12.8% |
| Tlingit-Haida | 1.3 /100 | #251 | Tragic 12.8% |
| French American Indians | 1.0 /100 | #252 | Tragic 12.7% |
| Immigrants | Dominica | 0.8 /100 | #253 | Tragic 12.6% |
| Indonesians | 0.8 /100 | #254 | Tragic 12.6% |
| Immigrants | Congo | 0.8 /100 | #255 | Tragic 12.6% |
| Immigrants | Portugal | 0.8 /100 | #256 | Tragic 12.6% |
Demographics Similar to Immigrants from Eastern Europe by Master's Degree
In terms of master's degree, the demographic groups most similar to Immigrants from Eastern Europe are Immigrants from Indonesia (17.6%, a difference of 0.12%), Egyptian (17.6%, a difference of 0.14%), Immigrants from Hungary (17.5%, a difference of 0.19%), Immigrants from Lebanon (17.5%, a difference of 0.33%), and Carpatho Rusyn (17.5%, a difference of 0.38%).
| Demographics | Rating | Rank | Master's Degree |
| Immigrants | Western Europe | 99.8 /100 | #70 | Exceptional 17.8% |
| Immigrants | Pakistan | 99.7 /100 | #71 | Exceptional 17.8% |
| Lithuanians | 99.7 /100 | #72 | Exceptional 17.7% |
| Zimbabweans | 99.7 /100 | #73 | Exceptional 17.7% |
| Immigrants | Romania | 99.7 /100 | #74 | Exceptional 17.7% |
| Egyptians | 99.6 /100 | #75 | Exceptional 17.6% |
| Immigrants | Indonesia | 99.6 /100 | #76 | Exceptional 17.6% |
| Immigrants | Eastern Europe | 99.6 /100 | #77 | Exceptional 17.6% |
| Immigrants | Hungary | 99.6 /100 | #78 | Exceptional 17.5% |
| Immigrants | Lebanon | 99.6 /100 | #79 | Exceptional 17.5% |
| Carpatho Rusyns | 99.6 /100 | #80 | Exceptional 17.5% |
| Immigrants | Western Asia | 99.5 /100 | #81 | Exceptional 17.5% |
| Greeks | 99.5 /100 | #82 | Exceptional 17.5% |
| Immigrants | Zimbabwe | 99.5 /100 | #83 | Exceptional 17.4% |
| Immigrants | Scotland | 99.4 /100 | #84 | Exceptional 17.4% |