Cree vs Dutch Master's Degree
COMPARE
Cree
Dutch
Master's Degree
Master's Degree Comparison
Cree
Dutch
12.8%
MASTER'S DEGREE
1.3/ 100
METRIC RATING
249th/ 347
METRIC RANK
13.8%
MASTER'S DEGREE
8.7/ 100
METRIC RATING
230th/ 347
METRIC RANK
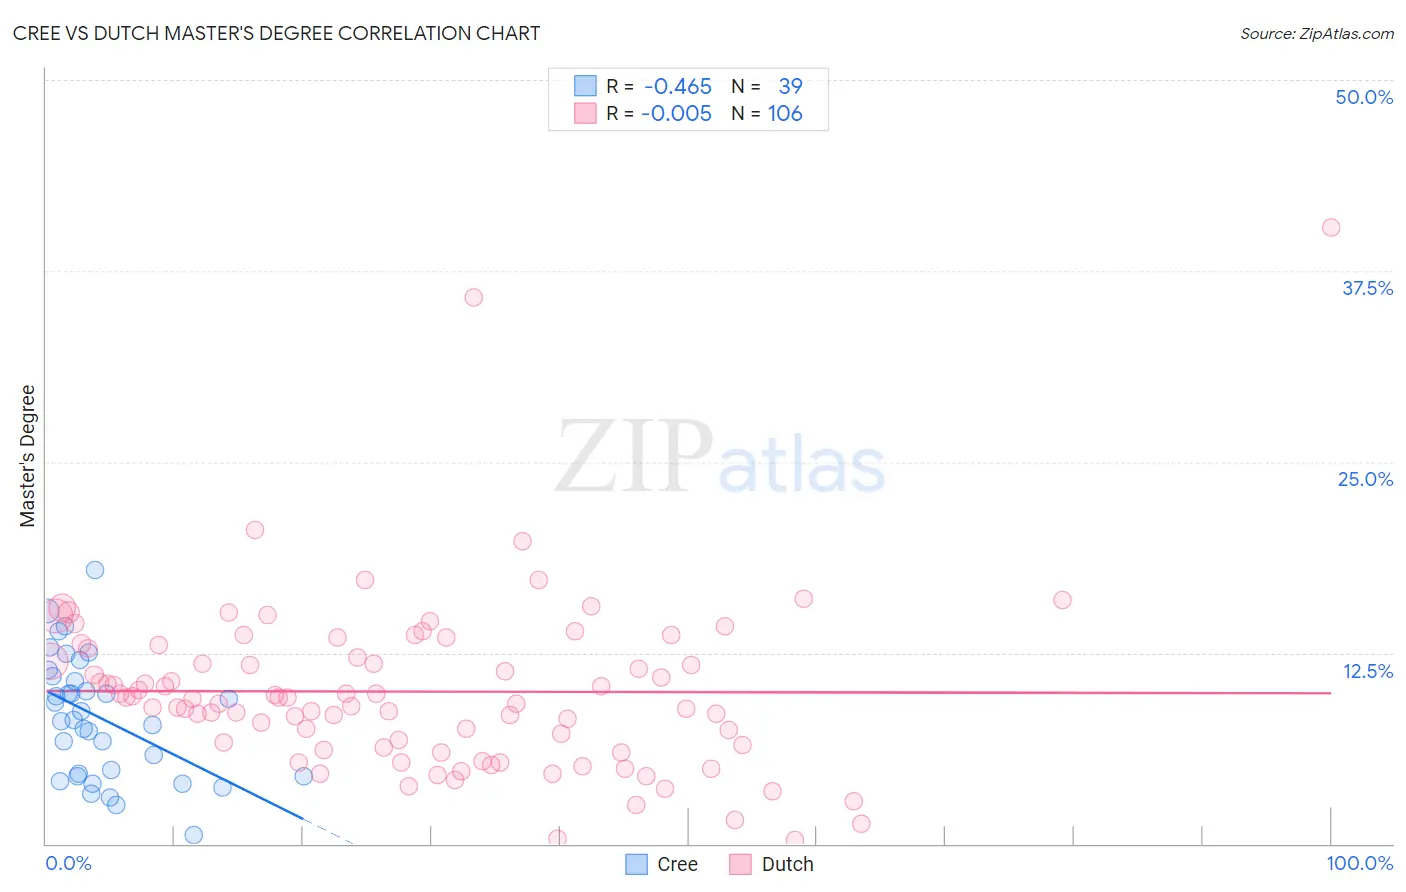
Cree vs Dutch Master's Degree Correlation Chart
The statistical analysis conducted on geographies consisting of 76,203,743 people shows a moderate negative correlation between the proportion of Cree and percentage of population with at least master's degree education in the United States with a correlation coefficient (R) of -0.465 and weighted average of 12.8%. Similarly, the statistical analysis conducted on geographies consisting of 553,710,662 people shows no correlation between the proportion of Dutch and percentage of population with at least master's degree education in the United States with a correlation coefficient (R) of -0.005 and weighted average of 13.8%, a difference of 7.4%.
Master's Degree Correlation Summary
| Measurement | Cree | Dutch |
| Minimum | 0.59% | 0.26% |
| Maximum | 17.9% | 40.4% |
| Range | 17.3% | 40.1% |
| Mean | 8.2% | 10.0% |
| Median | 8.1% | 9.5% |
| Interquartile 25% (IQ1) | 4.4% | 6.3% |
| Interquartile 75% (IQ3) | 11.0% | 12.8% |
| Interquartile Range (IQR) | 6.5% | 6.5% |
| Standard Deviation (Sample) | 4.0% | 5.7% |
| Standard Deviation (Population) | 3.9% | 5.7% |
Demographics Similar to Cree and Dutch by Master's Degree
In terms of master's degree, the demographic groups most similar to Cree are African (12.9%, a difference of 0.31%), Iroquois (12.9%, a difference of 0.40%), Immigrants from Cambodia (12.9%, a difference of 0.43%), Immigrants from Bahamas (12.9%, a difference of 0.47%), and Delaware (13.0%, a difference of 1.1%). Similarly, the demographic groups most similar to Dutch are British West Indian (13.8%, a difference of 0.030%), Guyanese (13.7%, a difference of 0.55%), Immigrants from Philippines (13.6%, a difference of 1.4%), Immigrants from Ecuador (13.6%, a difference of 1.6%), and Immigrants from Burma/Myanmar (13.5%, a difference of 2.1%).
| Demographics | Rating | Rank | Master's Degree |
| British West Indians | 8.8 /100 | #229 | Tragic 13.8% |
| Dutch | 8.7 /100 | #230 | Tragic 13.8% |
| Guyanese | 7.6 /100 | #231 | Tragic 13.7% |
| Immigrants | Philippines | 6.0 /100 | #232 | Tragic 13.6% |
| Immigrants | Ecuador | 5.7 /100 | #233 | Tragic 13.6% |
| Immigrants | Burma/Myanmar | 5.0 /100 | #234 | Tragic 13.5% |
| German Russians | 4.5 /100 | #235 | Tragic 13.5% |
| Immigrants | Guyana | 4.4 /100 | #236 | Tragic 13.4% |
| Jamaicans | 4.1 /100 | #237 | Tragic 13.4% |
| Hmong | 4.0 /100 | #238 | Tragic 13.4% |
| Immigrants | Nonimmigrants | 3.4 /100 | #239 | Tragic 13.3% |
| Guamanians/Chamorros | 2.2 /100 | #240 | Tragic 13.1% |
| U.S. Virgin Islanders | 2.1 /100 | #241 | Tragic 13.1% |
| Spanish Americans | 1.9 /100 | #242 | Tragic 13.0% |
| Immigrants | Jamaica | 1.9 /100 | #243 | Tragic 13.0% |
| Delaware | 1.7 /100 | #244 | Tragic 13.0% |
| Immigrants | Bahamas | 1.4 /100 | #245 | Tragic 12.9% |
| Immigrants | Cambodia | 1.4 /100 | #246 | Tragic 12.9% |
| Iroquois | 1.4 /100 | #247 | Tragic 12.9% |
| Africans | 1.4 /100 | #248 | Tragic 12.9% |
| Cree | 1.3 /100 | #249 | Tragic 12.8% |