Cree vs German Master's Degree
COMPARE
Cree
German
Master's Degree
Master's Degree Comparison
Cree
Germans
12.8%
MASTER'S DEGREE
1.3/ 100
METRIC RATING
249th/ 347
METRIC RANK
14.0%
MASTER'S DEGREE
13.1/ 100
METRIC RATING
220th/ 347
METRIC RANK
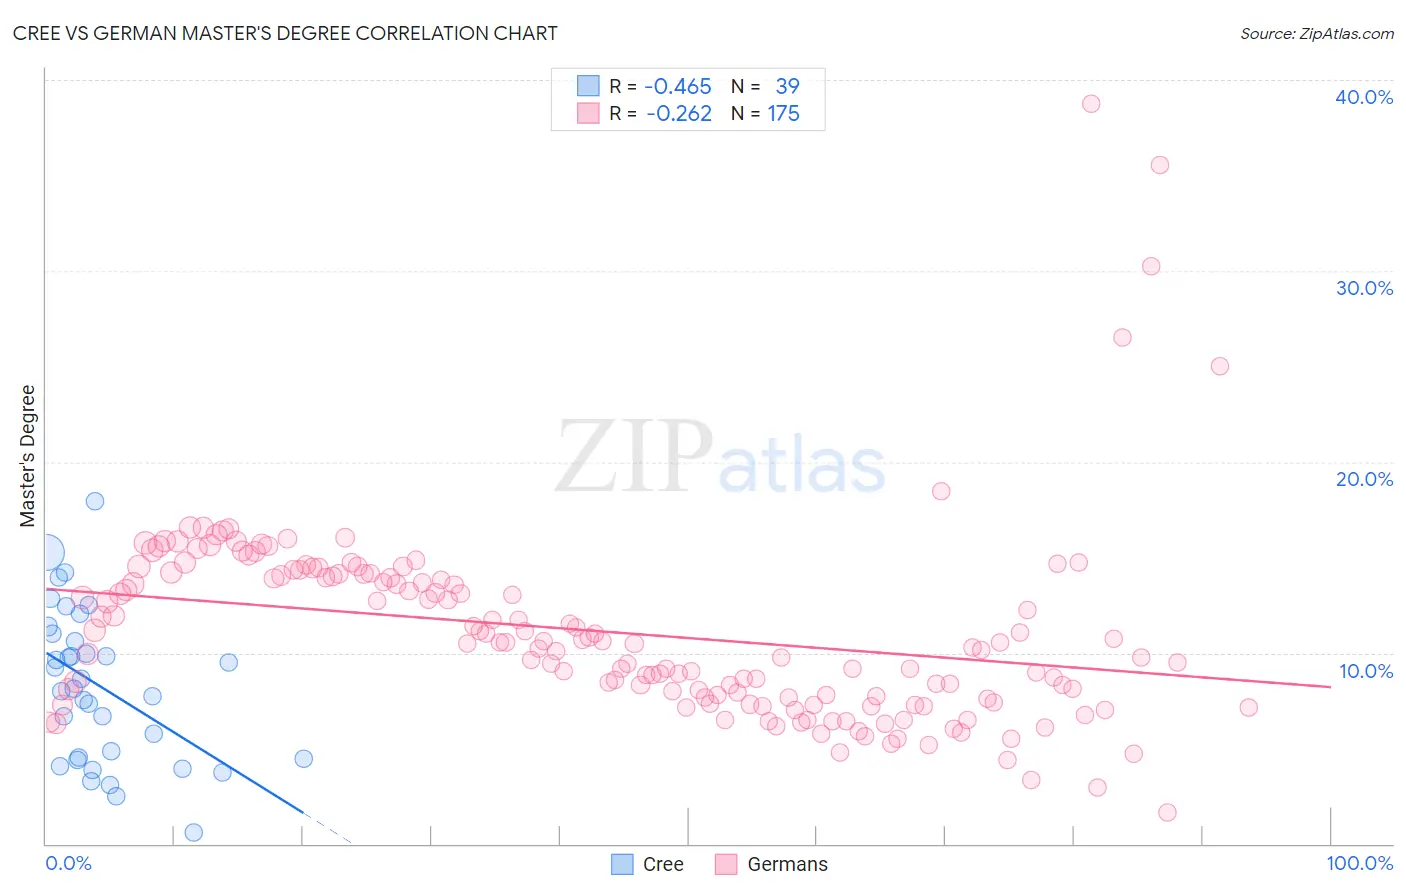
Cree vs German Master's Degree Correlation Chart
The statistical analysis conducted on geographies consisting of 76,203,743 people shows a moderate negative correlation between the proportion of Cree and percentage of population with at least master's degree education in the United States with a correlation coefficient (R) of -0.465 and weighted average of 12.8%. Similarly, the statistical analysis conducted on geographies consisting of 579,621,104 people shows a weak negative correlation between the proportion of Germans and percentage of population with at least master's degree education in the United States with a correlation coefficient (R) of -0.262 and weighted average of 14.0%, a difference of 9.1%.
Master's Degree Correlation Summary
| Measurement | Cree | German |
| Minimum | 0.59% | 1.7% |
| Maximum | 17.9% | 38.7% |
| Range | 17.3% | 37.1% |
| Mean | 8.2% | 11.1% |
| Median | 8.1% | 10.5% |
| Interquartile 25% (IQ1) | 4.4% | 7.6% |
| Interquartile 75% (IQ3) | 11.0% | 14.0% |
| Interquartile Range (IQR) | 6.5% | 6.4% |
| Standard Deviation (Sample) | 4.0% | 5.0% |
| Standard Deviation (Population) | 3.9% | 5.0% |
Similar Demographics by Master's Degree
Demographics Similar to Cree by Master's Degree
In terms of master's degree, the demographic groups most similar to Cree are Liberian (12.8%, a difference of 0.010%), Tlingit-Haida (12.8%, a difference of 0.040%), African (12.9%, a difference of 0.31%), Iroquois (12.9%, a difference of 0.40%), and Immigrants from Cambodia (12.9%, a difference of 0.43%).
| Demographics | Rating | Rank | Master's Degree |
| Spanish Americans | 1.9 /100 | #242 | Tragic 13.0% |
| Immigrants | Jamaica | 1.9 /100 | #243 | Tragic 13.0% |
| Delaware | 1.7 /100 | #244 | Tragic 13.0% |
| Immigrants | Bahamas | 1.4 /100 | #245 | Tragic 12.9% |
| Immigrants | Cambodia | 1.4 /100 | #246 | Tragic 12.9% |
| Iroquois | 1.4 /100 | #247 | Tragic 12.9% |
| Africans | 1.4 /100 | #248 | Tragic 12.9% |
| Cree | 1.3 /100 | #249 | Tragic 12.8% |
| Liberians | 1.3 /100 | #250 | Tragic 12.8% |
| Tlingit-Haida | 1.3 /100 | #251 | Tragic 12.8% |
| French American Indians | 1.0 /100 | #252 | Tragic 12.7% |
| Immigrants | Dominica | 0.8 /100 | #253 | Tragic 12.6% |
| Indonesians | 0.8 /100 | #254 | Tragic 12.6% |
| Immigrants | Congo | 0.8 /100 | #255 | Tragic 12.6% |
| Immigrants | Portugal | 0.8 /100 | #256 | Tragic 12.6% |
Demographics Similar to Germans by Master's Degree
In terms of master's degree, the demographic groups most similar to Germans are Korean (14.0%, a difference of 0.13%), Norwegian (14.0%, a difference of 0.15%), Ecuadorian (14.0%, a difference of 0.17%), Immigrants from South Eastern Asia (14.0%, a difference of 0.37%), and Immigrants from Grenada (14.0%, a difference of 0.41%).
| Demographics | Rating | Rank | Master's Degree |
| Immigrants | Thailand | 17.0 /100 | #213 | Poor 14.2% |
| Finns | 16.9 /100 | #214 | Poor 14.2% |
| Immigrants | Vietnam | 16.1 /100 | #215 | Poor 14.1% |
| Immigrants | Somalia | 15.8 /100 | #216 | Poor 14.1% |
| Immigrants | Trinidad and Tobago | 15.8 /100 | #217 | Poor 14.1% |
| French Canadians | 14.9 /100 | #218 | Poor 14.1% |
| Norwegians | 13.6 /100 | #219 | Poor 14.0% |
| Germans | 13.1 /100 | #220 | Poor 14.0% |
| Koreans | 12.7 /100 | #221 | Poor 14.0% |
| Ecuadorians | 12.6 /100 | #222 | Poor 14.0% |
| Immigrants | South Eastern Asia | 11.9 /100 | #223 | Poor 14.0% |
| Immigrants | Grenada | 11.8 /100 | #224 | Poor 14.0% |
| Portuguese | 11.2 /100 | #225 | Poor 13.9% |
| Immigrants | St. Vincent and the Grenadines | 11.0 /100 | #226 | Poor 13.9% |
| Immigrants | West Indies | 9.8 /100 | #227 | Tragic 13.9% |