Australian vs Immigrants from Belize Master's Degree
COMPARE
Australian
Immigrants from Belize
Master's Degree
Master's Degree Comparison
Australians
Immigrants from Belize
18.4%
MASTER'S DEGREE
99.9/ 100
METRIC RATING
58th/ 347
METRIC RANK
12.1%
MASTER'S DEGREE
0.2/ 100
METRIC RATING
279th/ 347
METRIC RANK
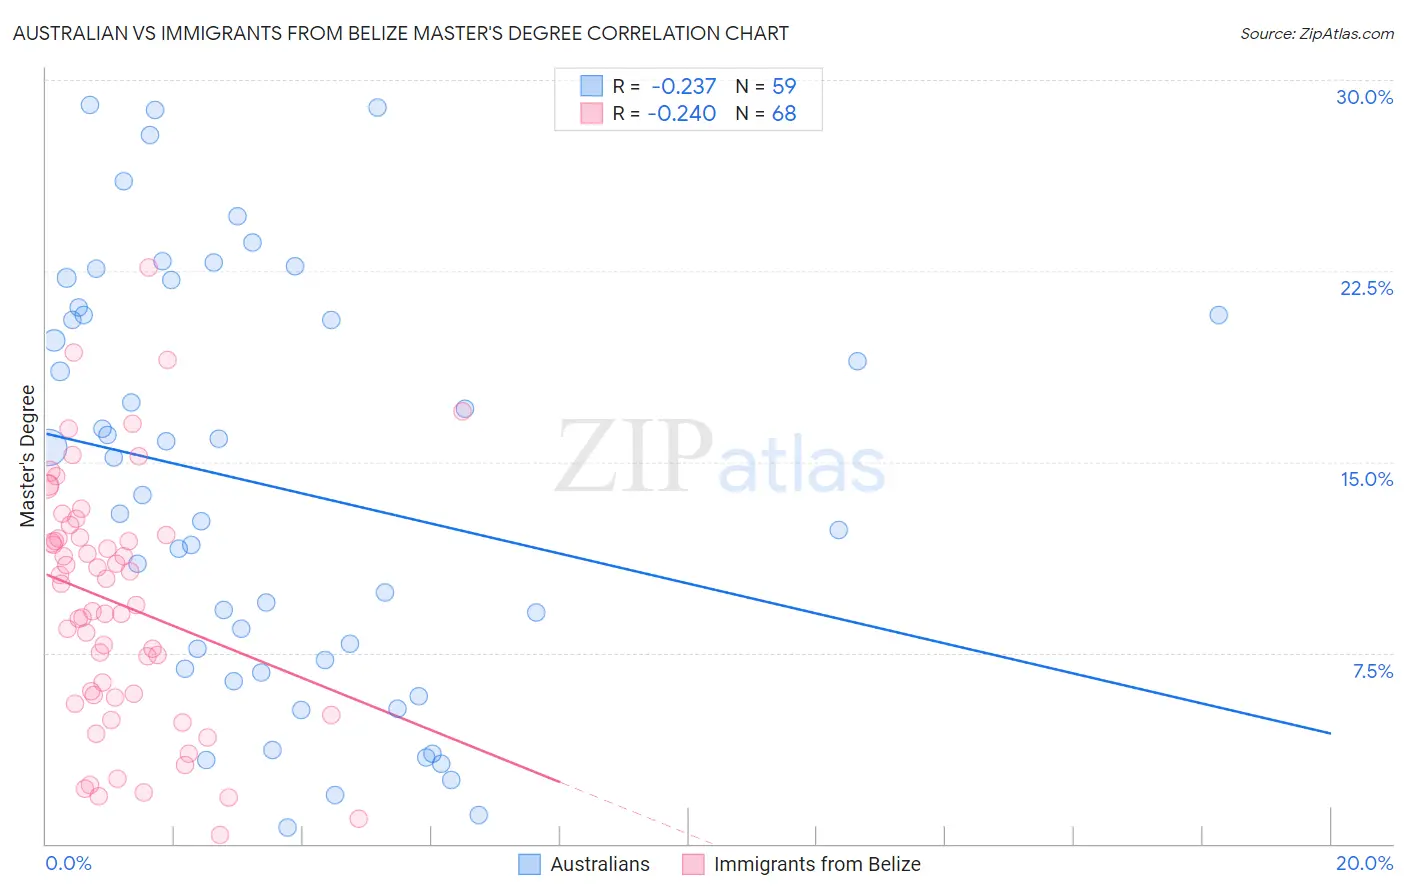
Australian vs Immigrants from Belize Master's Degree Correlation Chart
The statistical analysis conducted on geographies consisting of 224,102,387 people shows a weak negative correlation between the proportion of Australians and percentage of population with at least master's degree education in the United States with a correlation coefficient (R) of -0.237 and weighted average of 18.4%. Similarly, the statistical analysis conducted on geographies consisting of 130,312,912 people shows a weak negative correlation between the proportion of Immigrants from Belize and percentage of population with at least master's degree education in the United States with a correlation coefficient (R) of -0.240 and weighted average of 12.1%, a difference of 52.6%.
Master's Degree Correlation Summary
| Measurement | Australian | Immigrants from Belize |
| Minimum | 0.65% | 0.37% |
| Maximum | 29.0% | 22.6% |
| Range | 28.4% | 22.3% |
| Mean | 14.0% | 9.4% |
| Median | 13.7% | 9.8% |
| Interquartile 25% (IQ1) | 6.9% | 5.8% |
| Interquartile 75% (IQ3) | 20.7% | 12.1% |
| Interquartile Range (IQR) | 13.9% | 6.3% |
| Standard Deviation (Sample) | 8.1% | 4.8% |
| Standard Deviation (Population) | 8.1% | 4.8% |
Similar Demographics by Master's Degree
Demographics Similar to Australians by Master's Degree
In terms of master's degree, the demographic groups most similar to Australians are Immigrants from Asia (18.4%, a difference of 0.13%), Asian (18.4%, a difference of 0.27%), Immigrants from Bulgaria (18.3%, a difference of 0.44%), Immigrants from Serbia (18.5%, a difference of 0.49%), and Immigrants from Lithuania (18.5%, a difference of 0.53%).
| Demographics | Rating | Rank | Master's Degree |
| Immigrants | South Africa | 100.0 /100 | #51 | Exceptional 18.8% |
| Immigrants | Kuwait | 100.0 /100 | #52 | Exceptional 18.6% |
| Immigrants | Czechoslovakia | 99.9 /100 | #53 | Exceptional 18.5% |
| Immigrants | Lithuania | 99.9 /100 | #54 | Exceptional 18.5% |
| Immigrants | Serbia | 99.9 /100 | #55 | Exceptional 18.5% |
| Asians | 99.9 /100 | #56 | Exceptional 18.4% |
| Immigrants | Asia | 99.9 /100 | #57 | Exceptional 18.4% |
| Australians | 99.9 /100 | #58 | Exceptional 18.4% |
| Immigrants | Bulgaria | 99.9 /100 | #59 | Exceptional 18.3% |
| New Zealanders | 99.9 /100 | #60 | Exceptional 18.3% |
| Immigrants | Europe | 99.9 /100 | #61 | Exceptional 18.2% |
| Argentineans | 99.9 /100 | #62 | Exceptional 18.2% |
| Immigrants | Netherlands | 99.9 /100 | #63 | Exceptional 18.1% |
| South Africans | 99.9 /100 | #64 | Exceptional 18.1% |
| Immigrants | Kazakhstan | 99.8 /100 | #65 | Exceptional 18.0% |
Demographics Similar to Immigrants from Belize by Master's Degree
In terms of master's degree, the demographic groups most similar to Immigrants from Belize are Immigrants from Dominican Republic (12.1%, a difference of 0.060%), Immigrants from Caribbean (12.1%, a difference of 0.080%), Potawatomi (12.1%, a difference of 0.080%), Black/African American (12.1%, a difference of 0.090%), and Cuban (12.1%, a difference of 0.15%).
| Demographics | Rating | Rank | Master's Degree |
| Comanche | 0.3 /100 | #272 | Tragic 12.1% |
| Blackfeet | 0.3 /100 | #273 | Tragic 12.1% |
| Cape Verdeans | 0.3 /100 | #274 | Tragic 12.1% |
| Cubans | 0.3 /100 | #275 | Tragic 12.1% |
| Blacks/African Americans | 0.3 /100 | #276 | Tragic 12.1% |
| Immigrants | Caribbean | 0.3 /100 | #277 | Tragic 12.1% |
| Potawatomi | 0.3 /100 | #278 | Tragic 12.1% |
| Immigrants | Belize | 0.2 /100 | #279 | Tragic 12.1% |
| Immigrants | Dominican Republic | 0.2 /100 | #280 | Tragic 12.1% |
| Malaysians | 0.2 /100 | #281 | Tragic 12.0% |
| Immigrants | El Salvador | 0.2 /100 | #282 | Tragic 12.0% |
| Hondurans | 0.2 /100 | #283 | Tragic 11.9% |
| Ottawa | 0.2 /100 | #284 | Tragic 11.9% |
| Immigrants | Nicaragua | 0.2 /100 | #285 | Tragic 11.8% |
| Aleuts | 0.1 /100 | #286 | Tragic 11.8% |