Cree vs Immigrants from South America Master's Degree
COMPARE
Cree
Immigrants from South America
Master's Degree
Master's Degree Comparison
Cree
Immigrants from South America
12.8%
MASTER'S DEGREE
1.3/ 100
METRIC RATING
249th/ 347
METRIC RANK
15.5%
MASTER'S DEGREE
76.3/ 100
METRIC RATING
154th/ 347
METRIC RANK
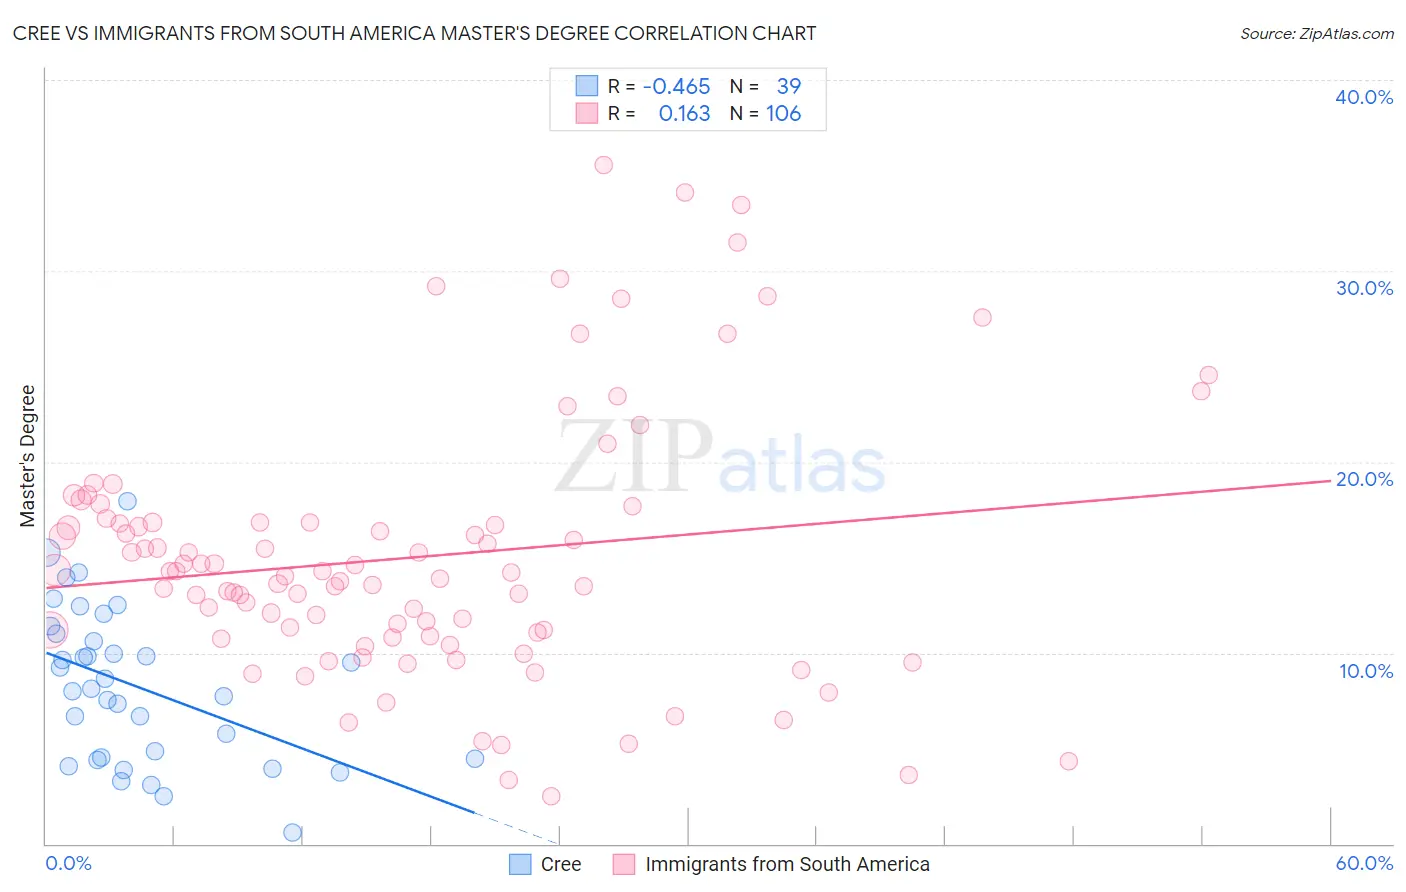
Cree vs Immigrants from South America Master's Degree Correlation Chart
The statistical analysis conducted on geographies consisting of 76,203,743 people shows a moderate negative correlation between the proportion of Cree and percentage of population with at least master's degree education in the United States with a correlation coefficient (R) of -0.465 and weighted average of 12.8%. Similarly, the statistical analysis conducted on geographies consisting of 486,157,509 people shows a poor positive correlation between the proportion of Immigrants from South America and percentage of population with at least master's degree education in the United States with a correlation coefficient (R) of 0.163 and weighted average of 15.5%, a difference of 20.5%.
Master's Degree Correlation Summary
| Measurement | Cree | Immigrants from South America |
| Minimum | 0.59% | 2.5% |
| Maximum | 17.9% | 35.5% |
| Range | 17.3% | 33.0% |
| Mean | 8.2% | 15.0% |
| Median | 8.1% | 14.1% |
| Interquartile 25% (IQ1) | 4.4% | 10.9% |
| Interquartile 75% (IQ3) | 11.0% | 16.8% |
| Interquartile Range (IQR) | 6.5% | 5.9% |
| Standard Deviation (Sample) | 4.0% | 6.8% |
| Standard Deviation (Population) | 3.9% | 6.8% |
Similar Demographics by Master's Degree
Demographics Similar to Cree by Master's Degree
In terms of master's degree, the demographic groups most similar to Cree are Liberian (12.8%, a difference of 0.010%), Tlingit-Haida (12.8%, a difference of 0.040%), African (12.9%, a difference of 0.31%), Iroquois (12.9%, a difference of 0.40%), and Immigrants from Cambodia (12.9%, a difference of 0.43%).
| Demographics | Rating | Rank | Master's Degree |
| Spanish Americans | 1.9 /100 | #242 | Tragic 13.0% |
| Immigrants | Jamaica | 1.9 /100 | #243 | Tragic 13.0% |
| Delaware | 1.7 /100 | #244 | Tragic 13.0% |
| Immigrants | Bahamas | 1.4 /100 | #245 | Tragic 12.9% |
| Immigrants | Cambodia | 1.4 /100 | #246 | Tragic 12.9% |
| Iroquois | 1.4 /100 | #247 | Tragic 12.9% |
| Africans | 1.4 /100 | #248 | Tragic 12.9% |
| Cree | 1.3 /100 | #249 | Tragic 12.8% |
| Liberians | 1.3 /100 | #250 | Tragic 12.8% |
| Tlingit-Haida | 1.3 /100 | #251 | Tragic 12.8% |
| French American Indians | 1.0 /100 | #252 | Tragic 12.7% |
| Immigrants | Dominica | 0.8 /100 | #253 | Tragic 12.6% |
| Indonesians | 0.8 /100 | #254 | Tragic 12.6% |
| Immigrants | Congo | 0.8 /100 | #255 | Tragic 12.6% |
| Immigrants | Portugal | 0.8 /100 | #256 | Tragic 12.6% |
Demographics Similar to Immigrants from South America by Master's Degree
In terms of master's degree, the demographic groups most similar to Immigrants from South America are Immigrants from Bangladesh (15.5%, a difference of 0.040%), Icelander (15.5%, a difference of 0.090%), Slavic (15.5%, a difference of 0.12%), Iraqi (15.5%, a difference of 0.17%), and Slovene (15.5%, a difference of 0.29%).
| Demographics | Rating | Rank | Master's Degree |
| Hungarians | 79.1 /100 | #147 | Good 15.6% |
| Immigrants | Senegal | 78.2 /100 | #148 | Good 15.5% |
| Ghanaians | 78.2 /100 | #149 | Good 15.5% |
| Slovenes | 78.0 /100 | #150 | Good 15.5% |
| Iraqis | 77.3 /100 | #151 | Good 15.5% |
| Slavs | 77.0 /100 | #152 | Good 15.5% |
| Icelanders | 76.8 /100 | #153 | Good 15.5% |
| Immigrants | South America | 76.3 /100 | #154 | Good 15.5% |
| Immigrants | Bangladesh | 76.1 /100 | #155 | Good 15.5% |
| Bermudans | 73.9 /100 | #156 | Good 15.4% |
| Immigrants | Cameroon | 71.7 /100 | #157 | Good 15.4% |
| Immigrants | Poland | 71.5 /100 | #158 | Good 15.4% |
| Luxembourgers | 71.0 /100 | #159 | Good 15.3% |
| Kenyans | 70.3 /100 | #160 | Good 15.3% |
| Sudanese | 68.7 /100 | #161 | Good 15.3% |