Cree vs Immigrants from Belize Doctorate Degree
COMPARE
Cree
Immigrants from Belize
Doctorate Degree
Doctorate Degree Comparison
Cree
Immigrants from Belize
1.6%
DOCTORATE DEGREE
3.0/ 100
METRIC RATING
235th/ 347
METRIC RANK
1.3%
DOCTORATE DEGREE
0.1/ 100
METRIC RATING
323rd/ 347
METRIC RANK
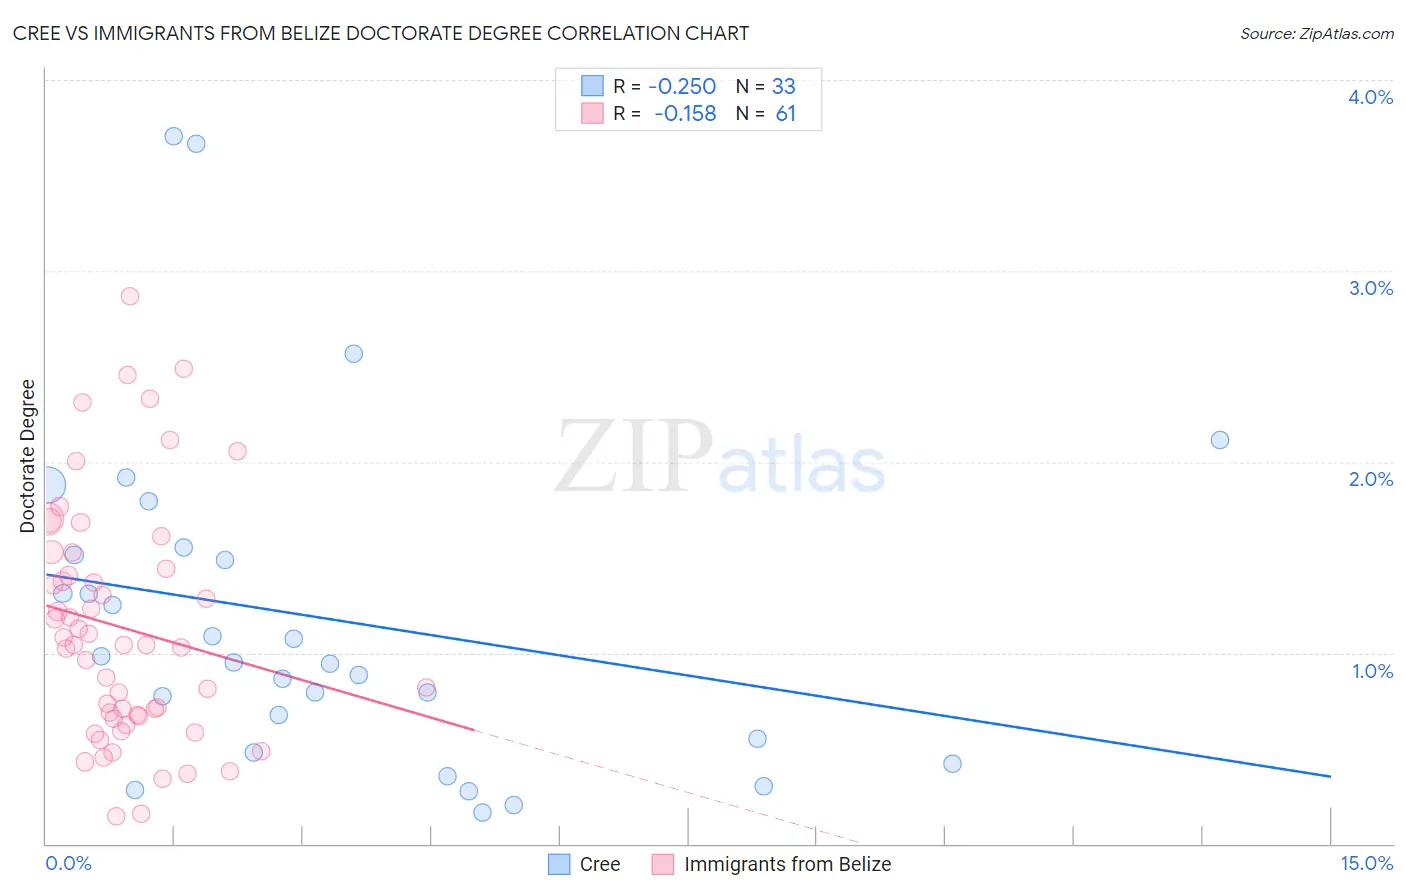
Cree vs Immigrants from Belize Doctorate Degree Correlation Chart
The statistical analysis conducted on geographies consisting of 75,903,599 people shows a weak negative correlation between the proportion of Cree and percentage of population with at least doctorate degree education in the United States with a correlation coefficient (R) of -0.250 and weighted average of 1.6%. Similarly, the statistical analysis conducted on geographies consisting of 129,933,258 people shows a poor negative correlation between the proportion of Immigrants from Belize and percentage of population with at least doctorate degree education in the United States with a correlation coefficient (R) of -0.158 and weighted average of 1.3%, a difference of 20.8%.
Doctorate Degree Correlation Summary
| Measurement | Cree | Immigrants from Belize |
| Minimum | 0.17% | 0.14% |
| Maximum | 3.7% | 2.9% |
| Range | 3.5% | 2.7% |
| Mean | 1.2% | 1.1% |
| Median | 0.95% | 1.0% |
| Interquartile 25% (IQ1) | 0.51% | 0.66% |
| Interquartile 75% (IQ3) | 1.5% | 1.5% |
| Interquartile Range (IQR) | 1.0% | 0.82% |
| Standard Deviation (Sample) | 0.88% | 0.62% |
| Standard Deviation (Population) | 0.87% | 0.62% |
Similar Demographics by Doctorate Degree
Demographics Similar to Cree by Doctorate Degree
In terms of doctorate degree, the demographic groups most similar to Cree are Hopi (1.6%, a difference of 0.21%), Indonesian (1.6%, a difference of 0.29%), Barbadian (1.6%, a difference of 0.36%), Guamanian/Chamorro (1.6%, a difference of 0.43%), and Iroquois (1.6%, a difference of 0.47%).
| Demographics | Rating | Rank | Doctorate Degree |
| Assyrians/Chaldeans/Syriacs | 5.9 /100 | #228 | Tragic 1.7% |
| Colville | 4.7 /100 | #229 | Tragic 1.6% |
| Immigrants | Philippines | 4.3 /100 | #230 | Tragic 1.6% |
| Immigrants | North Macedonia | 3.9 /100 | #231 | Tragic 1.6% |
| Guamanians/Chamorros | 3.3 /100 | #232 | Tragic 1.6% |
| Barbadians | 3.3 /100 | #233 | Tragic 1.6% |
| Hopi | 3.2 /100 | #234 | Tragic 1.6% |
| Cree | 3.0 /100 | #235 | Tragic 1.6% |
| Indonesians | 2.8 /100 | #236 | Tragic 1.6% |
| Iroquois | 2.7 /100 | #237 | Tragic 1.6% |
| Immigrants | Congo | 2.6 /100 | #238 | Tragic 1.6% |
| West Indians | 2.5 /100 | #239 | Tragic 1.6% |
| Immigrants | Panama | 2.4 /100 | #240 | Tragic 1.6% |
| Cheyenne | 2.3 /100 | #241 | Tragic 1.6% |
| Ottawa | 2.2 /100 | #242 | Tragic 1.6% |
Demographics Similar to Immigrants from Belize by Doctorate Degree
In terms of doctorate degree, the demographic groups most similar to Immigrants from Belize are Seminole (1.3%, a difference of 0.20%), Dutch West Indian (1.3%, a difference of 0.26%), Native/Alaskan (1.3%, a difference of 0.32%), Immigrants from St. Vincent and the Grenadines (1.3%, a difference of 0.36%), and Immigrants from Guyana (1.3%, a difference of 0.43%).
| Demographics | Rating | Rank | Doctorate Degree |
| Navajo | 0.1 /100 | #316 | Tragic 1.4% |
| Immigrants | Micronesia | 0.1 /100 | #317 | Tragic 1.3% |
| Creek | 0.1 /100 | #318 | Tragic 1.3% |
| Immigrants | Guyana | 0.1 /100 | #319 | Tragic 1.3% |
| Immigrants | St. Vincent and the Grenadines | 0.1 /100 | #320 | Tragic 1.3% |
| Dutch West Indians | 0.1 /100 | #321 | Tragic 1.3% |
| Seminole | 0.1 /100 | #322 | Tragic 1.3% |
| Immigrants | Belize | 0.1 /100 | #323 | Tragic 1.3% |
| Natives/Alaskans | 0.0 /100 | #324 | Tragic 1.3% |
| Pima | 0.0 /100 | #325 | Tragic 1.3% |
| Immigrants | Cabo Verde | 0.0 /100 | #326 | Tragic 1.3% |
| Hispanics or Latinos | 0.0 /100 | #327 | Tragic 1.3% |
| Inupiat | 0.0 /100 | #328 | Tragic 1.3% |
| Haitians | 0.0 /100 | #329 | Tragic 1.3% |
| Yup'ik | 0.0 /100 | #330 | Tragic 1.3% |