Cree vs Immigrants from Belize 2nd Grade
COMPARE
Cree
Immigrants from Belize
2nd Grade
2nd Grade Comparison
Cree
Immigrants from Belize
98.2%
2ND GRADE
98.0/ 100
METRIC RATING
102nd/ 347
METRIC RANK
96.8%
2ND GRADE
0.0/ 100
METRIC RATING
315th/ 347
METRIC RANK
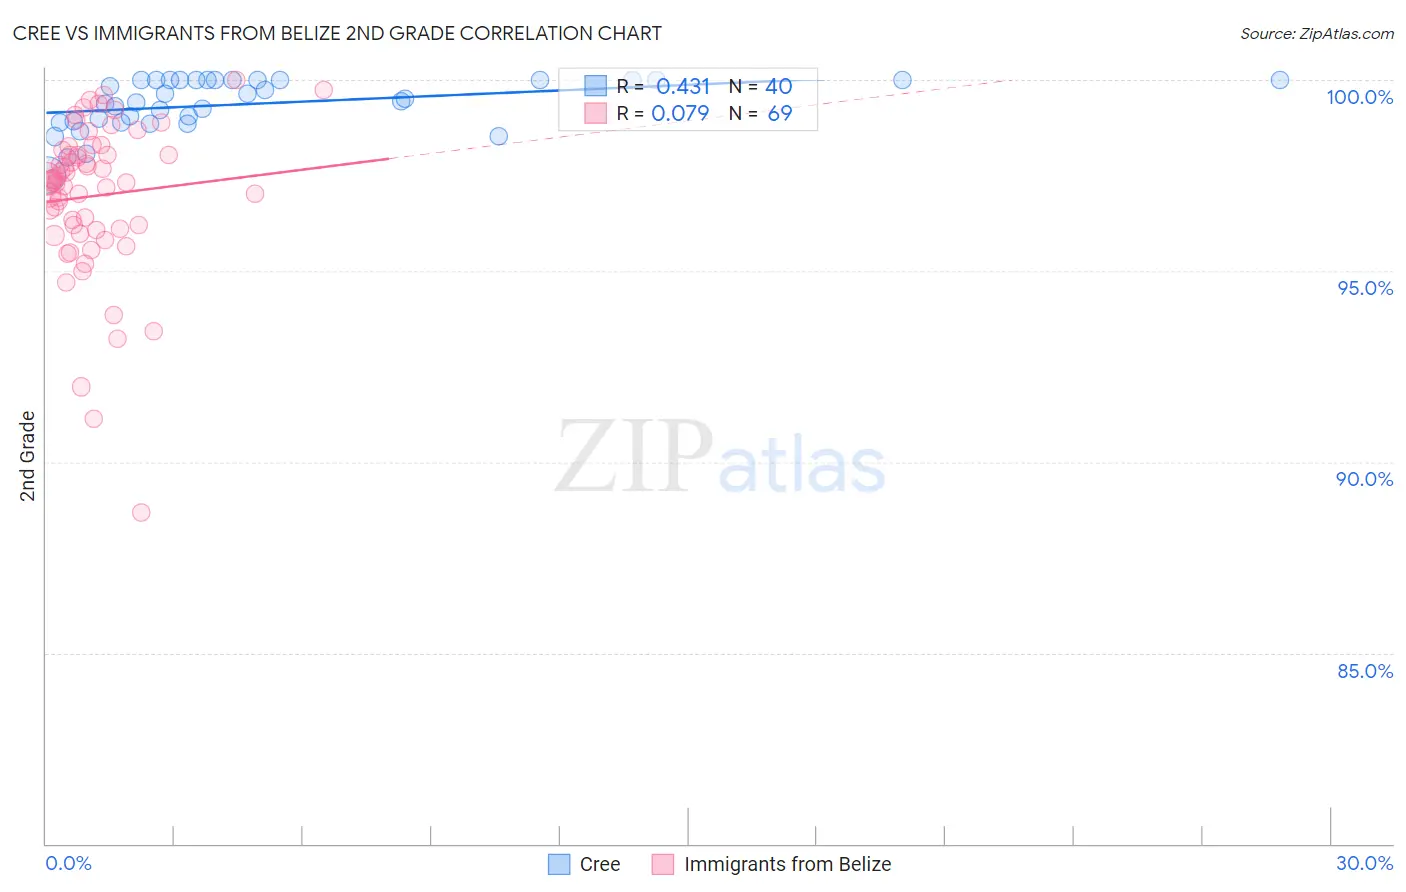
Cree vs Immigrants from Belize 2nd Grade Correlation Chart
The statistical analysis conducted on geographies consisting of 76,204,399 people shows a moderate positive correlation between the proportion of Cree and percentage of population with at least 2nd grade education in the United States with a correlation coefficient (R) of 0.431 and weighted average of 98.2%. Similarly, the statistical analysis conducted on geographies consisting of 130,328,311 people shows a slight positive correlation between the proportion of Immigrants from Belize and percentage of population with at least 2nd grade education in the United States with a correlation coefficient (R) of 0.079 and weighted average of 96.8%, a difference of 1.5%.
2nd Grade Correlation Summary
| Measurement | Cree | Immigrants from Belize |
| Minimum | 97.5% | 88.7% |
| Maximum | 100.0% | 100.0% |
| Range | 2.5% | 11.3% |
| Mean | 99.4% | 97.0% |
| Median | 99.5% | 97.4% |
| Interquartile 25% (IQ1) | 98.9% | 96.1% |
| Interquartile 75% (IQ3) | 100.0% | 98.1% |
| Interquartile Range (IQR) | 1.1% | 2.0% |
| Standard Deviation (Sample) | 0.66% | 2.0% |
| Standard Deviation (Population) | 0.65% | 2.0% |
Similar Demographics by 2nd Grade
Demographics Similar to Cree by 2nd Grade
In terms of 2nd grade, the demographic groups most similar to Cree are Immigrants from Ireland (98.2%, a difference of 0.0%), Romanian (98.2%, a difference of 0.0%), Puget Sound Salish (98.2%, a difference of 0.0%), Choctaw (98.2%, a difference of 0.010%), and Nonimmigrants (98.2%, a difference of 0.010%).
| Demographics | Rating | Rank | 2nd Grade |
| South Africans | 98.6 /100 | #95 | Exceptional 98.2% |
| Cypriots | 98.4 /100 | #96 | Exceptional 98.2% |
| Choctaw | 98.3 /100 | #97 | Exceptional 98.2% |
| Immigrants | Nonimmigrants | 98.3 /100 | #98 | Exceptional 98.2% |
| Immigrants | Ireland | 98.0 /100 | #99 | Exceptional 98.2% |
| Romanians | 98.0 /100 | #100 | Exceptional 98.2% |
| Puget Sound Salish | 98.0 /100 | #101 | Exceptional 98.2% |
| Cree | 98.0 /100 | #102 | Exceptional 98.2% |
| Pima | 97.6 /100 | #103 | Exceptional 98.2% |
| Turks | 97.6 /100 | #104 | Exceptional 98.2% |
| Yugoslavians | 97.5 /100 | #105 | Exceptional 98.2% |
| Bhutanese | 97.5 /100 | #106 | Exceptional 98.1% |
| German Russians | 97.4 /100 | #107 | Exceptional 98.1% |
| Immigrants | Switzerland | 97.3 /100 | #108 | Exceptional 98.1% |
| Basques | 97.2 /100 | #109 | Exceptional 98.1% |
Demographics Similar to Immigrants from Belize by 2nd Grade
In terms of 2nd grade, the demographic groups most similar to Immigrants from Belize are Honduran (96.7%, a difference of 0.010%), Immigrants from Laos (96.7%, a difference of 0.010%), Indonesian (96.7%, a difference of 0.010%), Immigrants from Nicaragua (96.7%, a difference of 0.010%), and Immigrants from Ecuador (96.8%, a difference of 0.020%).
| Demographics | Rating | Rank | 2nd Grade |
| Immigrants | Haiti | 0.0 /100 | #308 | Tragic 96.8% |
| Belizeans | 0.0 /100 | #309 | Tragic 96.8% |
| Sri Lankans | 0.0 /100 | #310 | Tragic 96.8% |
| Guyanese | 0.0 /100 | #311 | Tragic 96.8% |
| Cape Verdeans | 0.0 /100 | #312 | Tragic 96.8% |
| Hispanics or Latinos | 0.0 /100 | #313 | Tragic 96.8% |
| Immigrants | Ecuador | 0.0 /100 | #314 | Tragic 96.8% |
| Immigrants | Belize | 0.0 /100 | #315 | Tragic 96.8% |
| Hondurans | 0.0 /100 | #316 | Tragic 96.7% |
| Immigrants | Laos | 0.0 /100 | #317 | Tragic 96.7% |
| Indonesians | 0.0 /100 | #318 | Tragic 96.7% |
| Immigrants | Nicaragua | 0.0 /100 | #319 | Tragic 96.7% |
| Immigrants | Guyana | 0.0 /100 | #320 | Tragic 96.7% |
| Immigrants | Burma/Myanmar | 0.0 /100 | #321 | Tragic 96.7% |
| Immigrants | Bangladesh | 0.0 /100 | #322 | Tragic 96.7% |