Cree vs Tohono O'odham Master's Degree
COMPARE
Cree
Tohono O'odham
Master's Degree
Master's Degree Comparison
Cree
Tohono O'odham
12.8%
MASTER'S DEGREE
1.3/ 100
METRIC RATING
249th/ 347
METRIC RANK
9.7%
MASTER'S DEGREE
0.0/ 100
METRIC RATING
338th/ 347
METRIC RANK
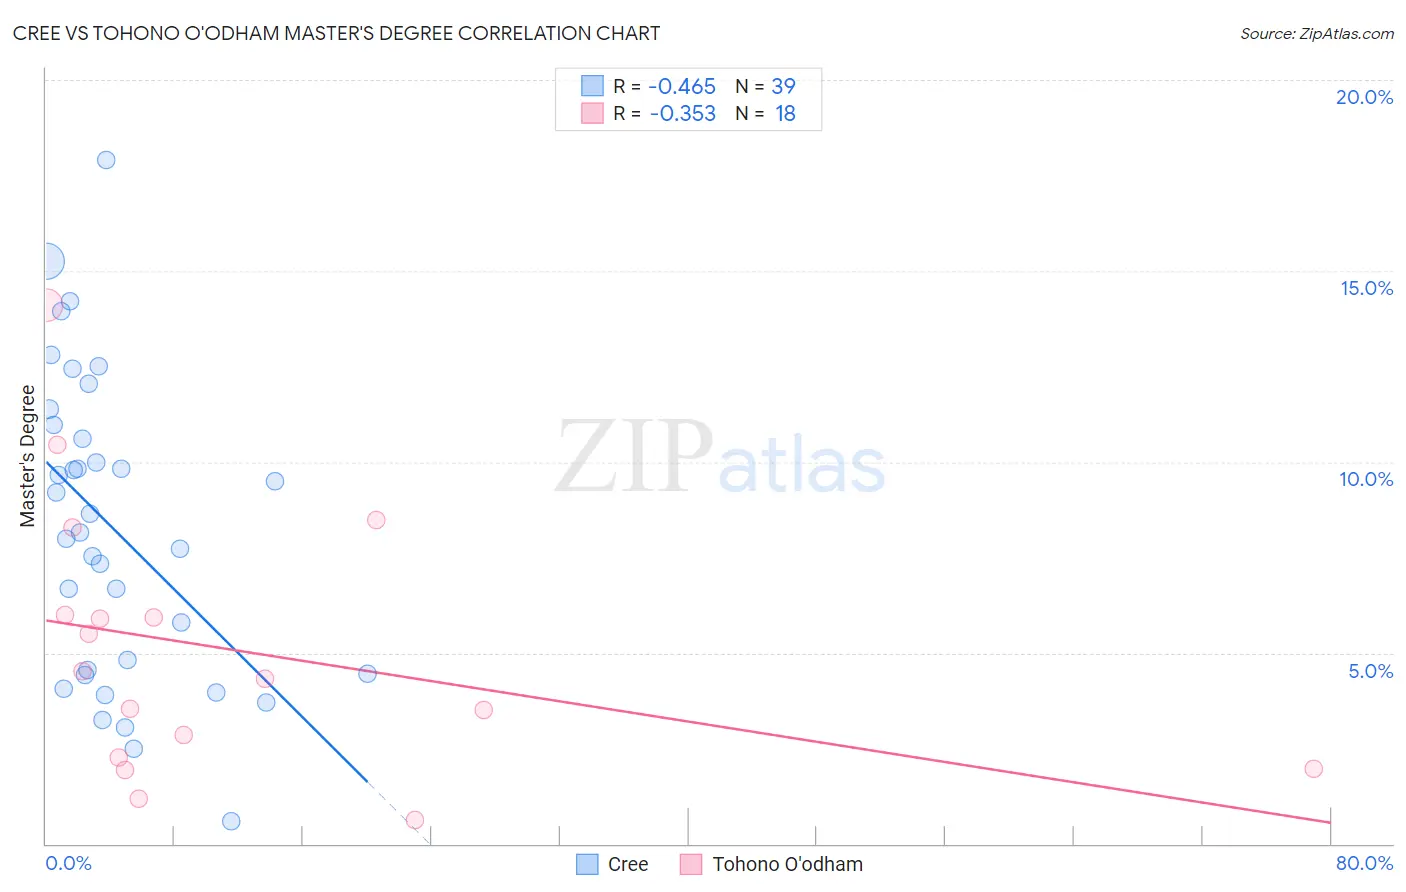
Cree vs Tohono O'odham Master's Degree Correlation Chart
The statistical analysis conducted on geographies consisting of 76,203,743 people shows a moderate negative correlation between the proportion of Cree and percentage of population with at least master's degree education in the United States with a correlation coefficient (R) of -0.465 and weighted average of 12.8%. Similarly, the statistical analysis conducted on geographies consisting of 58,714,512 people shows a mild negative correlation between the proportion of Tohono O'odham and percentage of population with at least master's degree education in the United States with a correlation coefficient (R) of -0.353 and weighted average of 9.7%, a difference of 32.3%.
Master's Degree Correlation Summary
| Measurement | Cree | Tohono O'odham |
| Minimum | 0.59% | 0.61% |
| Maximum | 17.9% | 14.1% |
| Range | 17.3% | 13.5% |
| Mean | 8.2% | 5.1% |
| Median | 8.1% | 4.4% |
| Interquartile 25% (IQ1) | 4.4% | 2.3% |
| Interquartile 75% (IQ3) | 11.0% | 6.0% |
| Interquartile Range (IQR) | 6.5% | 3.7% |
| Standard Deviation (Sample) | 4.0% | 3.5% |
| Standard Deviation (Population) | 3.9% | 3.4% |
Similar Demographics by Master's Degree
Demographics Similar to Cree by Master's Degree
In terms of master's degree, the demographic groups most similar to Cree are Liberian (12.8%, a difference of 0.010%), Tlingit-Haida (12.8%, a difference of 0.040%), African (12.9%, a difference of 0.31%), Iroquois (12.9%, a difference of 0.40%), and Immigrants from Cambodia (12.9%, a difference of 0.43%).
| Demographics | Rating | Rank | Master's Degree |
| Spanish Americans | 1.9 /100 | #242 | Tragic 13.0% |
| Immigrants | Jamaica | 1.9 /100 | #243 | Tragic 13.0% |
| Delaware | 1.7 /100 | #244 | Tragic 13.0% |
| Immigrants | Bahamas | 1.4 /100 | #245 | Tragic 12.9% |
| Immigrants | Cambodia | 1.4 /100 | #246 | Tragic 12.9% |
| Iroquois | 1.4 /100 | #247 | Tragic 12.9% |
| Africans | 1.4 /100 | #248 | Tragic 12.9% |
| Cree | 1.3 /100 | #249 | Tragic 12.8% |
| Liberians | 1.3 /100 | #250 | Tragic 12.8% |
| Tlingit-Haida | 1.3 /100 | #251 | Tragic 12.8% |
| French American Indians | 1.0 /100 | #252 | Tragic 12.7% |
| Immigrants | Dominica | 0.8 /100 | #253 | Tragic 12.6% |
| Indonesians | 0.8 /100 | #254 | Tragic 12.6% |
| Immigrants | Congo | 0.8 /100 | #255 | Tragic 12.6% |
| Immigrants | Portugal | 0.8 /100 | #256 | Tragic 12.6% |
Demographics Similar to Tohono O'odham by Master's Degree
In terms of master's degree, the demographic groups most similar to Tohono O'odham are Mexican (9.7%, a difference of 0.080%), Spanish American Indian (9.6%, a difference of 1.3%), Native/Alaskan (9.9%, a difference of 2.3%), Yakama (9.5%, a difference of 2.6%), and Immigrants from Central America (10.0%, a difference of 2.9%).
| Demographics | Rating | Rank | Master's Degree |
| Pueblo | 0.0 /100 | #331 | Tragic 10.3% |
| Immigrants | Azores | 0.0 /100 | #332 | Tragic 10.2% |
| Menominee | 0.0 /100 | #333 | Tragic 10.2% |
| Arapaho | 0.0 /100 | #334 | Tragic 10.0% |
| Immigrants | Central America | 0.0 /100 | #335 | Tragic 10.0% |
| Natives/Alaskans | 0.0 /100 | #336 | Tragic 9.9% |
| Mexicans | 0.0 /100 | #337 | Tragic 9.7% |
| Tohono O'odham | 0.0 /100 | #338 | Tragic 9.7% |
| Spanish American Indians | 0.0 /100 | #339 | Tragic 9.6% |
| Yakama | 0.0 /100 | #340 | Tragic 9.5% |
| Navajo | 0.0 /100 | #341 | Tragic 9.4% |
| Immigrants | Mexico | 0.0 /100 | #342 | Tragic 9.3% |
| Lumbee | 0.0 /100 | #343 | Tragic 9.3% |
| Pima | 0.0 /100 | #344 | Tragic 9.2% |
| Yuman | 0.0 /100 | #345 | Tragic 9.2% |