Cree vs Italian Master's Degree
COMPARE
Cree
Italian
Master's Degree
Master's Degree Comparison
Cree
Italians
12.8%
MASTER'S DEGREE
1.3/ 100
METRIC RATING
249th/ 347
METRIC RANK
16.4%
MASTER'S DEGREE
95.4/ 100
METRIC RATING
125th/ 347
METRIC RANK
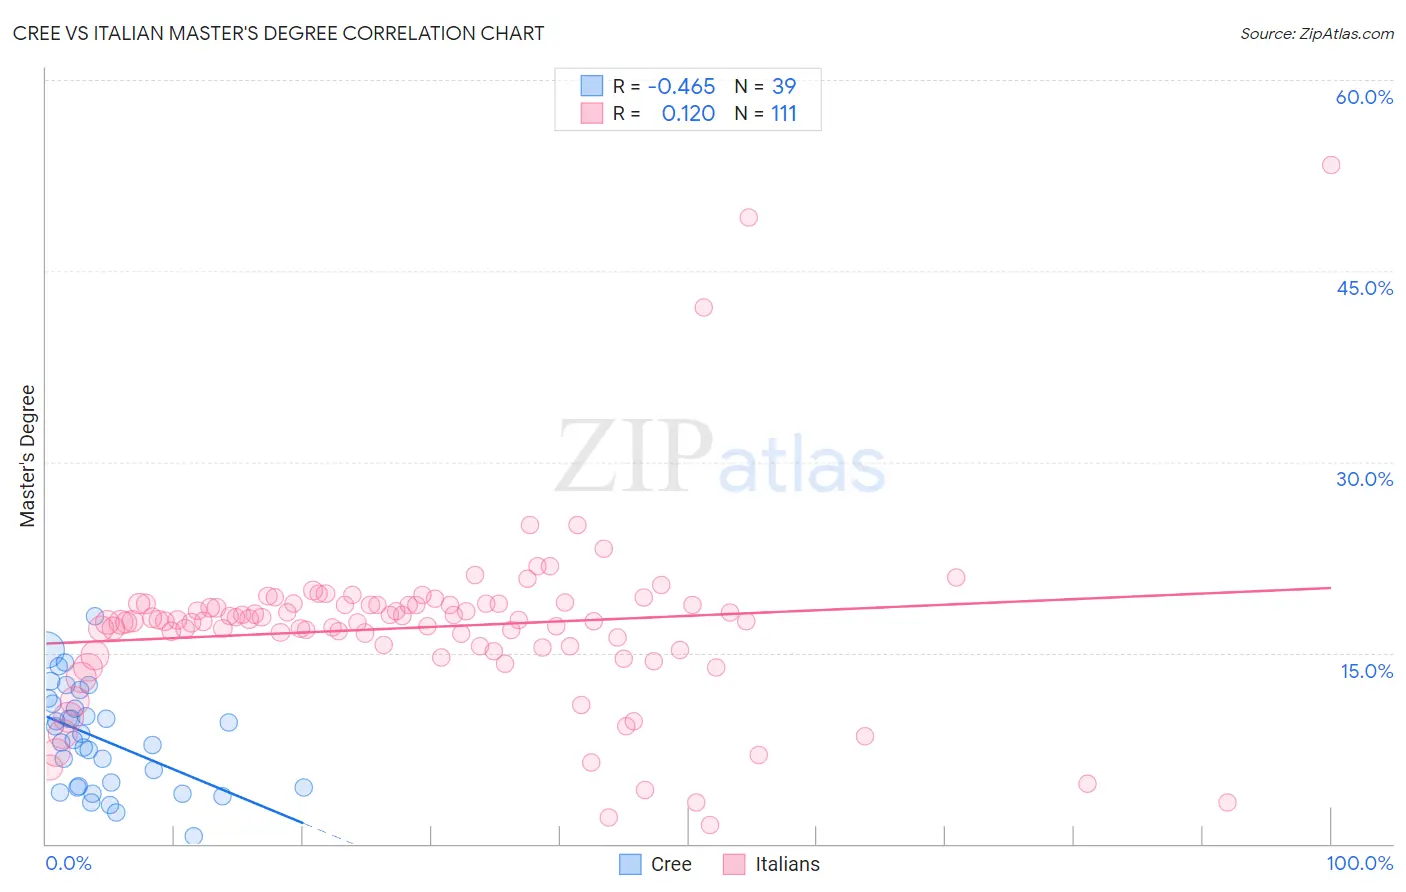
Cree vs Italian Master's Degree Correlation Chart
The statistical analysis conducted on geographies consisting of 76,203,743 people shows a moderate negative correlation between the proportion of Cree and percentage of population with at least master's degree education in the United States with a correlation coefficient (R) of -0.465 and weighted average of 12.8%. Similarly, the statistical analysis conducted on geographies consisting of 574,113,330 people shows a poor positive correlation between the proportion of Italians and percentage of population with at least master's degree education in the United States with a correlation coefficient (R) of 0.120 and weighted average of 16.4%, a difference of 27.4%.
Master's Degree Correlation Summary
| Measurement | Cree | Italian |
| Minimum | 0.59% | 1.5% |
| Maximum | 17.9% | 53.3% |
| Range | 17.3% | 51.8% |
| Mean | 8.2% | 17.0% |
| Median | 8.1% | 17.5% |
| Interquartile 25% (IQ1) | 4.4% | 15.4% |
| Interquartile 75% (IQ3) | 11.0% | 18.8% |
| Interquartile Range (IQR) | 6.5% | 3.4% |
| Standard Deviation (Sample) | 4.0% | 7.0% |
| Standard Deviation (Population) | 3.9% | 7.0% |
Similar Demographics by Master's Degree
Demographics Similar to Cree by Master's Degree
In terms of master's degree, the demographic groups most similar to Cree are Liberian (12.8%, a difference of 0.010%), Tlingit-Haida (12.8%, a difference of 0.040%), African (12.9%, a difference of 0.31%), Iroquois (12.9%, a difference of 0.40%), and Immigrants from Cambodia (12.9%, a difference of 0.43%).
| Demographics | Rating | Rank | Master's Degree |
| Spanish Americans | 1.9 /100 | #242 | Tragic 13.0% |
| Immigrants | Jamaica | 1.9 /100 | #243 | Tragic 13.0% |
| Delaware | 1.7 /100 | #244 | Tragic 13.0% |
| Immigrants | Bahamas | 1.4 /100 | #245 | Tragic 12.9% |
| Immigrants | Cambodia | 1.4 /100 | #246 | Tragic 12.9% |
| Iroquois | 1.4 /100 | #247 | Tragic 12.9% |
| Africans | 1.4 /100 | #248 | Tragic 12.9% |
| Cree | 1.3 /100 | #249 | Tragic 12.8% |
| Liberians | 1.3 /100 | #250 | Tragic 12.8% |
| Tlingit-Haida | 1.3 /100 | #251 | Tragic 12.8% |
| French American Indians | 1.0 /100 | #252 | Tragic 12.7% |
| Immigrants | Dominica | 0.8 /100 | #253 | Tragic 12.6% |
| Indonesians | 0.8 /100 | #254 | Tragic 12.6% |
| Immigrants | Congo | 0.8 /100 | #255 | Tragic 12.6% |
| Immigrants | Portugal | 0.8 /100 | #256 | Tragic 12.6% |
Demographics Similar to Italians by Master's Degree
In terms of master's degree, the demographic groups most similar to Italians are Immigrants from Eritrea (16.4%, a difference of 0.070%), Immigrants from Eastern Africa (16.3%, a difference of 0.11%), Croatian (16.4%, a difference of 0.14%), British (16.4%, a difference of 0.16%), and Palestinian (16.3%, a difference of 0.37%).
| Demographics | Rating | Rank | Master's Degree |
| Brazilians | 96.8 /100 | #118 | Exceptional 16.5% |
| Jordanians | 96.5 /100 | #119 | Exceptional 16.5% |
| Lebanese | 96.4 /100 | #120 | Exceptional 16.5% |
| Afghans | 96.2 /100 | #121 | Exceptional 16.5% |
| British | 95.6 /100 | #122 | Exceptional 16.4% |
| Croatians | 95.6 /100 | #123 | Exceptional 16.4% |
| Immigrants | Eritrea | 95.5 /100 | #124 | Exceptional 16.4% |
| Italians | 95.4 /100 | #125 | Exceptional 16.4% |
| Immigrants | Eastern Africa | 95.2 /100 | #126 | Exceptional 16.3% |
| Palestinians | 94.8 /100 | #127 | Exceptional 16.3% |
| Immigrants | Sierra Leone | 94.7 /100 | #128 | Exceptional 16.3% |
| Immigrants | Syria | 93.3 /100 | #129 | Exceptional 16.2% |
| Immigrants | Jordan | 92.7 /100 | #130 | Exceptional 16.1% |
| Taiwanese | 91.9 /100 | #131 | Exceptional 16.1% |
| Serbians | 91.7 /100 | #132 | Exceptional 16.1% |