Cheyenne vs Immigrants from Ecuador Doctorate Degree
COMPARE
Cheyenne
Immigrants from Ecuador
Doctorate Degree
Doctorate Degree Comparison
Cheyenne
Immigrants from Ecuador
1.6%
DOCTORATE DEGREE
2.3/ 100
METRIC RATING
241st/ 347
METRIC RANK
1.4%
DOCTORATE DEGREE
0.2/ 100
METRIC RATING
296th/ 347
METRIC RANK
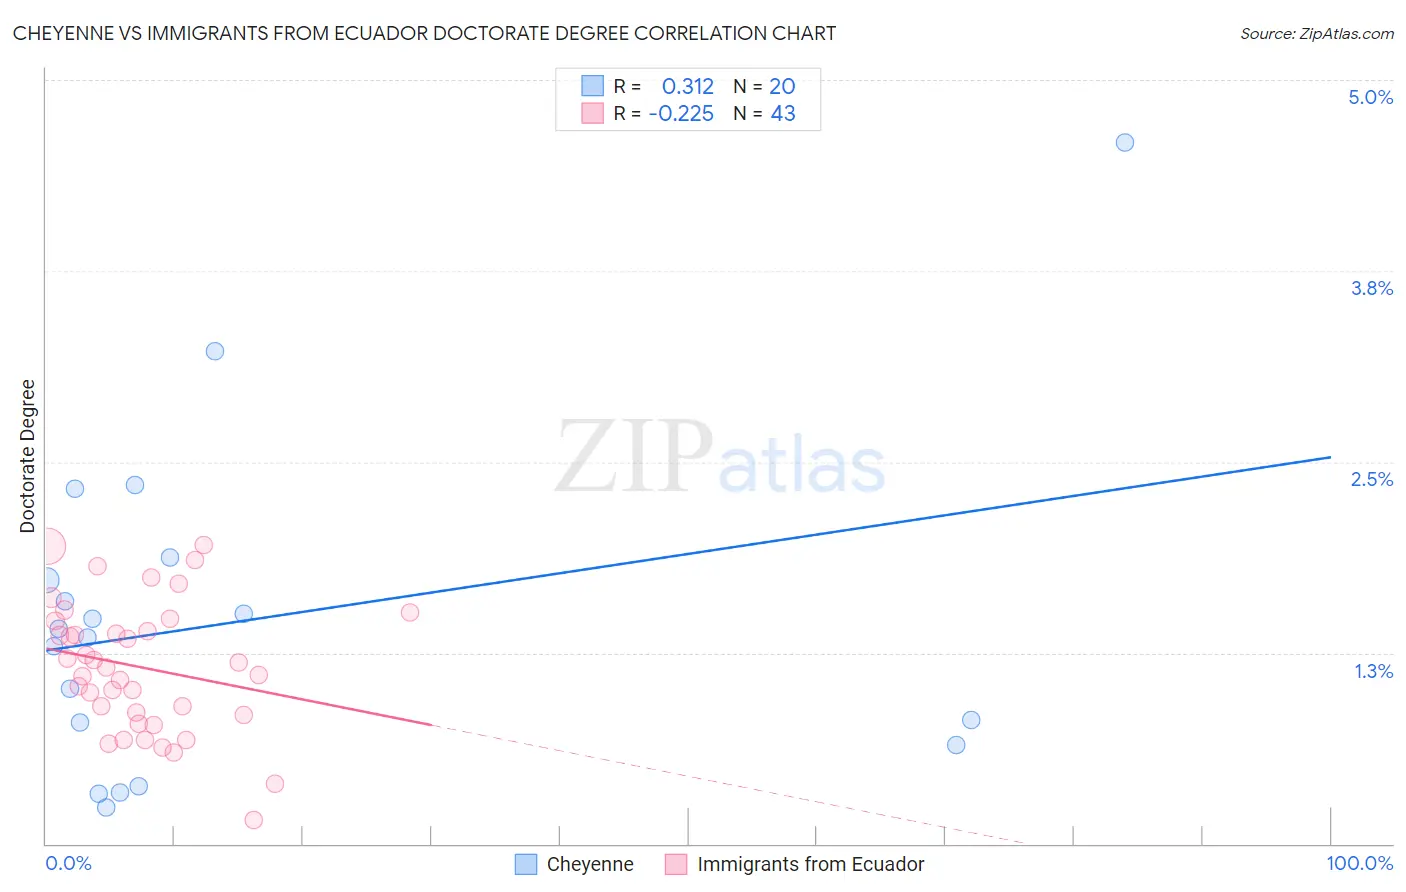
Cheyenne vs Immigrants from Ecuador Doctorate Degree Correlation Chart
The statistical analysis conducted on geographies consisting of 80,230,104 people shows a mild positive correlation between the proportion of Cheyenne and percentage of population with at least doctorate degree education in the United States with a correlation coefficient (R) of 0.312 and weighted average of 1.6%. Similarly, the statistical analysis conducted on geographies consisting of 269,753,528 people shows a weak negative correlation between the proportion of Immigrants from Ecuador and percentage of population with at least doctorate degree education in the United States with a correlation coefficient (R) of -0.225 and weighted average of 1.4%, a difference of 12.6%.
Doctorate Degree Correlation Summary
| Measurement | Cheyenne | Immigrants from Ecuador |
| Minimum | 0.23% | 0.16% |
| Maximum | 4.6% | 2.0% |
| Range | 4.4% | 1.8% |
| Mean | 1.5% | 1.2% |
| Median | 1.4% | 1.2% |
| Interquartile 25% (IQ1) | 0.72% | 0.84% |
| Interquartile 75% (IQ3) | 1.8% | 1.5% |
| Interquartile Range (IQR) | 1.1% | 0.62% |
| Standard Deviation (Sample) | 1.1% | 0.42% |
| Standard Deviation (Population) | 1.0% | 0.42% |
Similar Demographics by Doctorate Degree
Demographics Similar to Cheyenne by Doctorate Degree
In terms of doctorate degree, the demographic groups most similar to Cheyenne are Immigrants from Panama (1.6%, a difference of 0.19%), Ottawa (1.6%, a difference of 0.21%), Native Hawaiian (1.6%, a difference of 0.34%), West Indian (1.6%, a difference of 0.38%), and Immigrants from Congo (1.6%, a difference of 0.48%).
| Demographics | Rating | Rank | Doctorate Degree |
| Hopi | 3.2 /100 | #234 | Tragic 1.6% |
| Cree | 3.0 /100 | #235 | Tragic 1.6% |
| Indonesians | 2.8 /100 | #236 | Tragic 1.6% |
| Iroquois | 2.7 /100 | #237 | Tragic 1.6% |
| Immigrants | Congo | 2.6 /100 | #238 | Tragic 1.6% |
| West Indians | 2.5 /100 | #239 | Tragic 1.6% |
| Immigrants | Panama | 2.4 /100 | #240 | Tragic 1.6% |
| Cheyenne | 2.3 /100 | #241 | Tragic 1.6% |
| Ottawa | 2.2 /100 | #242 | Tragic 1.6% |
| Native Hawaiians | 2.1 /100 | #243 | Tragic 1.6% |
| French American Indians | 2.0 /100 | #244 | Tragic 1.6% |
| Delaware | 1.9 /100 | #245 | Tragic 1.6% |
| Hmong | 1.8 /100 | #246 | Tragic 1.6% |
| Comanche | 1.8 /100 | #247 | Tragic 1.6% |
| Africans | 1.8 /100 | #248 | Tragic 1.6% |
Demographics Similar to Immigrants from Ecuador by Doctorate Degree
In terms of doctorate degree, the demographic groups most similar to Immigrants from Ecuador are Tsimshian (1.4%, a difference of 0.22%), Guatemalan (1.4%, a difference of 0.23%), Puerto Rican (1.4%, a difference of 0.63%), Samoan (1.4%, a difference of 0.94%), and Belizean (1.4%, a difference of 1.1%).
| Demographics | Rating | Rank | Doctorate Degree |
| Cape Verdeans | 0.3 /100 | #289 | Tragic 1.4% |
| Choctaw | 0.3 /100 | #290 | Tragic 1.4% |
| Blacks/African Americans | 0.3 /100 | #291 | Tragic 1.4% |
| Alaska Natives | 0.3 /100 | #292 | Tragic 1.4% |
| Immigrants | Yemen | 0.2 /100 | #293 | Tragic 1.4% |
| Samoans | 0.2 /100 | #294 | Tragic 1.4% |
| Guatemalans | 0.2 /100 | #295 | Tragic 1.4% |
| Immigrants | Ecuador | 0.2 /100 | #296 | Tragic 1.4% |
| Tsimshian | 0.2 /100 | #297 | Tragic 1.4% |
| Puerto Ricans | 0.1 /100 | #298 | Tragic 1.4% |
| Belizeans | 0.1 /100 | #299 | Tragic 1.4% |
| Immigrants | Guatemala | 0.1 /100 | #300 | Tragic 1.4% |
| Hondurans | 0.1 /100 | #301 | Tragic 1.4% |
| Shoshone | 0.1 /100 | #302 | Tragic 1.4% |
| Immigrants | Dominica | 0.1 /100 | #303 | Tragic 1.4% |