Celtic vs Immigrants from Portugal No Schooling Completed
COMPARE
Celtic
Immigrants from Portugal
No Schooling Completed
No Schooling Completed Comparison
Celtics
Immigrants from Portugal
1.6%
NO SCHOOLING COMPLETED
99.9/ 100
METRIC RATING
50th/ 347
METRIC RANK
2.7%
NO SCHOOLING COMPLETED
0.0/ 100
METRIC RATING
286th/ 347
METRIC RANK
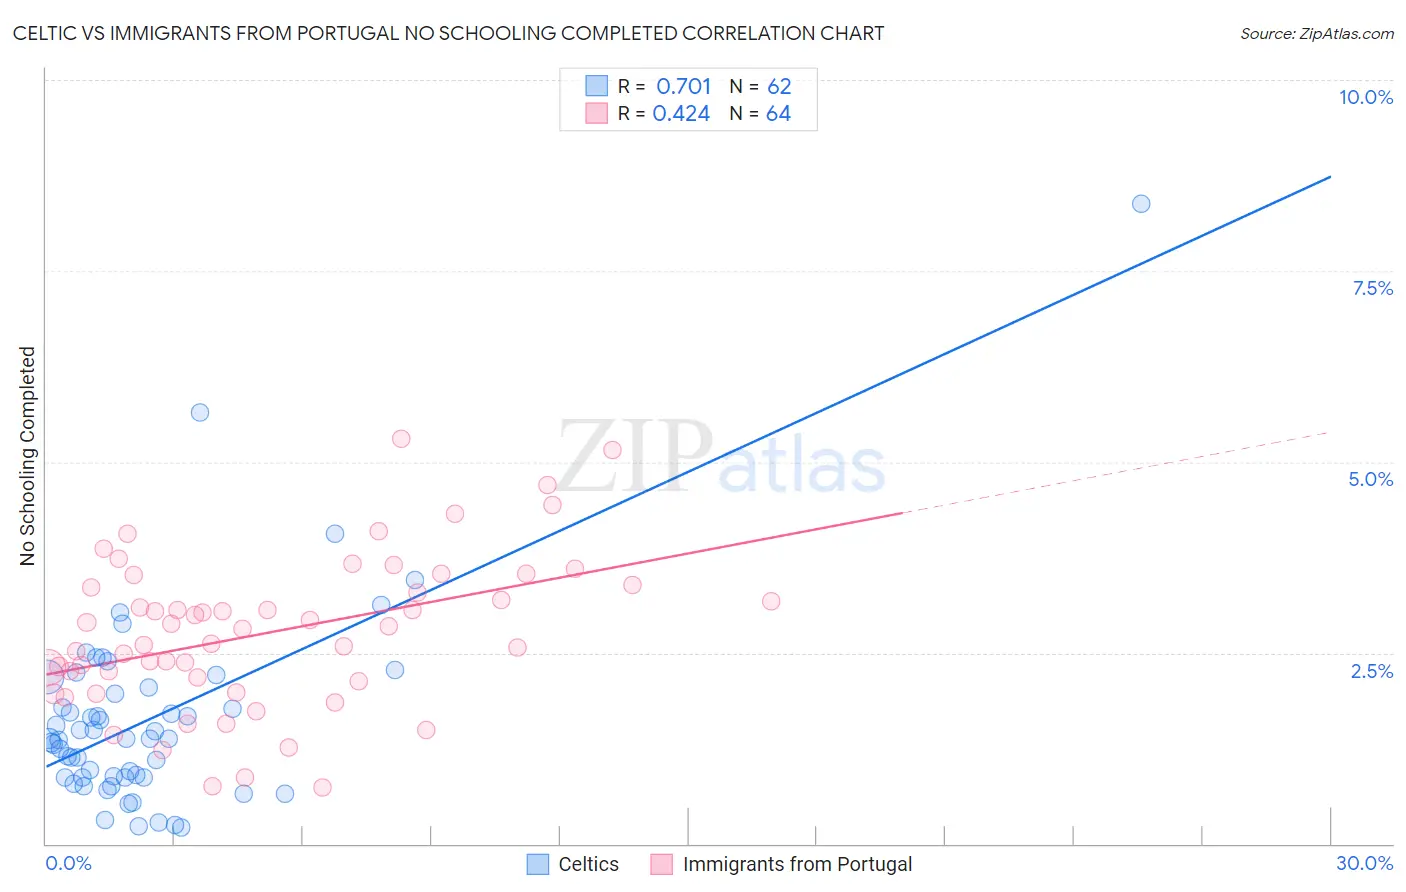
Celtic vs Immigrants from Portugal No Schooling Completed Correlation Chart
The statistical analysis conducted on geographies consisting of 167,819,688 people shows a strong positive correlation between the proportion of Celtics and percentage of population with no schooling in the United States with a correlation coefficient (R) of 0.701 and weighted average of 1.6%. Similarly, the statistical analysis conducted on geographies consisting of 174,032,123 people shows a moderate positive correlation between the proportion of Immigrants from Portugal and percentage of population with no schooling in the United States with a correlation coefficient (R) of 0.424 and weighted average of 2.7%, a difference of 63.5%.
No Schooling Completed Correlation Summary
| Measurement | Celtic | Immigrants from Portugal |
| Minimum | 0.22% | 0.74% |
| Maximum | 8.4% | 5.3% |
| Range | 8.2% | 4.6% |
| Mean | 1.6% | 2.8% |
| Median | 1.4% | 2.8% |
| Interquartile 25% (IQ1) | 0.87% | 2.1% |
| Interquartile 75% (IQ3) | 2.0% | 3.4% |
| Interquartile Range (IQR) | 1.2% | 1.2% |
| Standard Deviation (Sample) | 1.3% | 1.00% |
| Standard Deviation (Population) | 1.3% | 0.99% |
Similar Demographics by No Schooling Completed
Demographics Similar to Celtics by No Schooling Completed
In terms of no schooling completed, the demographic groups most similar to Celtics are White/Caucasian (1.6%, a difference of 0.13%), Immigrants from Scotland (1.6%, a difference of 0.19%), Chippewa (1.6%, a difference of 0.20%), Immigrants from Canada (1.6%, a difference of 0.27%), and Creek (1.6%, a difference of 0.40%).
| Demographics | Rating | Rank | No Schooling Completed |
| Australians | 99.9 /100 | #43 | Exceptional 1.6% |
| Estonians | 99.9 /100 | #44 | Exceptional 1.6% |
| Czechoslovakians | 99.9 /100 | #45 | Exceptional 1.6% |
| Maltese | 99.9 /100 | #46 | Exceptional 1.6% |
| Ottawa | 99.9 /100 | #47 | Exceptional 1.6% |
| Immigrants | Scotland | 99.9 /100 | #48 | Exceptional 1.6% |
| Whites/Caucasians | 99.9 /100 | #49 | Exceptional 1.6% |
| Celtics | 99.9 /100 | #50 | Exceptional 1.6% |
| Chippewa | 99.8 /100 | #51 | Exceptional 1.6% |
| Immigrants | Canada | 99.8 /100 | #52 | Exceptional 1.6% |
| Creek | 99.8 /100 | #53 | Exceptional 1.6% |
| Crow | 99.8 /100 | #54 | Exceptional 1.6% |
| Greeks | 99.8 /100 | #55 | Exceptional 1.6% |
| Immigrants | North America | 99.8 /100 | #56 | Exceptional 1.6% |
| Austrians | 99.8 /100 | #57 | Exceptional 1.6% |
Demographics Similar to Immigrants from Portugal by No Schooling Completed
In terms of no schooling completed, the demographic groups most similar to Immigrants from Portugal are Immigrants from Barbados (2.7%, a difference of 0.42%), Immigrants from West Indies (2.7%, a difference of 0.49%), Immigrants from Afghanistan (2.7%, a difference of 0.81%), Immigrants from St. Vincent and the Grenadines (2.7%, a difference of 0.91%), and Immigrants from Trinidad and Tobago (2.6%, a difference of 1.2%).
| Demographics | Rating | Rank | No Schooling Completed |
| Barbadians | 0.1 /100 | #279 | Tragic 2.6% |
| Trinidadians and Tobagonians | 0.1 /100 | #280 | Tragic 2.6% |
| Afghans | 0.1 /100 | #281 | Tragic 2.6% |
| Immigrants | Ghana | 0.1 /100 | #282 | Tragic 2.6% |
| Immigrants | Trinidad and Tobago | 0.0 /100 | #283 | Tragic 2.6% |
| Immigrants | West Indies | 0.0 /100 | #284 | Tragic 2.7% |
| Immigrants | Barbados | 0.0 /100 | #285 | Tragic 2.7% |
| Immigrants | Portugal | 0.0 /100 | #286 | Tragic 2.7% |
| Immigrants | Afghanistan | 0.0 /100 | #287 | Tragic 2.7% |
| Immigrants | St. Vincent and the Grenadines | 0.0 /100 | #288 | Tragic 2.7% |
| Immigrants | Thailand | 0.0 /100 | #289 | Tragic 2.7% |
| Immigrants | Hong Kong | 0.0 /100 | #290 | Tragic 2.7% |
| British West Indians | 0.0 /100 | #291 | Tragic 2.7% |
| Immigrants | Grenada | 0.0 /100 | #292 | Tragic 2.8% |
| Malaysians | 0.0 /100 | #293 | Tragic 2.8% |