Celtic vs Carpatho Rusyn No Schooling Completed
COMPARE
Celtic
Carpatho Rusyn
No Schooling Completed
No Schooling Completed Comparison
Celtics
Carpatho Rusyns
1.6%
NO SCHOOLING COMPLETED
99.9/ 100
METRIC RATING
50th/ 347
METRIC RANK
1.4%
NO SCHOOLING COMPLETED
100.0/ 100
METRIC RATING
6th/ 347
METRIC RANK
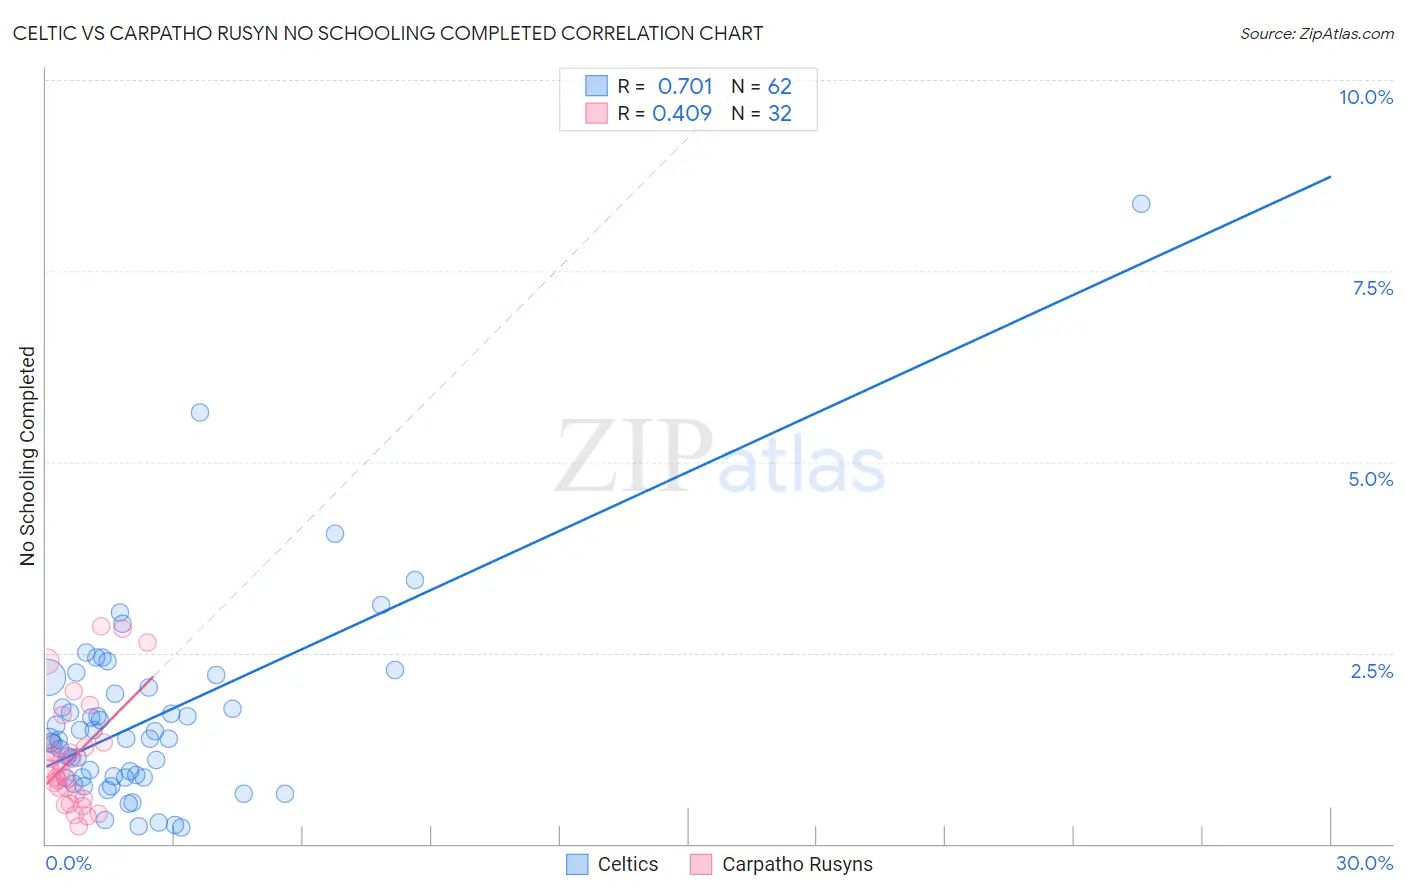
Celtic vs Carpatho Rusyn No Schooling Completed Correlation Chart
The statistical analysis conducted on geographies consisting of 167,819,688 people shows a strong positive correlation between the proportion of Celtics and percentage of population with no schooling in the United States with a correlation coefficient (R) of 0.701 and weighted average of 1.6%. Similarly, the statistical analysis conducted on geographies consisting of 58,721,636 people shows a moderate positive correlation between the proportion of Carpatho Rusyns and percentage of population with no schooling in the United States with a correlation coefficient (R) of 0.409 and weighted average of 1.4%, a difference of 18.9%.
No Schooling Completed Correlation Summary
| Measurement | Celtic | Carpatho Rusyn |
| Minimum | 0.22% | 0.23% |
| Maximum | 8.4% | 2.8% |
| Range | 8.2% | 2.6% |
| Mean | 1.6% | 1.1% |
| Median | 1.4% | 0.97% |
| Interquartile 25% (IQ1) | 0.87% | 0.62% |
| Interquartile 75% (IQ3) | 2.0% | 1.3% |
| Interquartile Range (IQR) | 1.2% | 0.70% |
| Standard Deviation (Sample) | 1.3% | 0.72% |
| Standard Deviation (Population) | 1.3% | 0.71% |
Similar Demographics by No Schooling Completed
Demographics Similar to Celtics by No Schooling Completed
In terms of no schooling completed, the demographic groups most similar to Celtics are White/Caucasian (1.6%, a difference of 0.13%), Immigrants from Scotland (1.6%, a difference of 0.19%), Chippewa (1.6%, a difference of 0.20%), Immigrants from Canada (1.6%, a difference of 0.27%), and Creek (1.6%, a difference of 0.40%).
| Demographics | Rating | Rank | No Schooling Completed |
| Australians | 99.9 /100 | #43 | Exceptional 1.6% |
| Estonians | 99.9 /100 | #44 | Exceptional 1.6% |
| Czechoslovakians | 99.9 /100 | #45 | Exceptional 1.6% |
| Maltese | 99.9 /100 | #46 | Exceptional 1.6% |
| Ottawa | 99.9 /100 | #47 | Exceptional 1.6% |
| Immigrants | Scotland | 99.9 /100 | #48 | Exceptional 1.6% |
| Whites/Caucasians | 99.9 /100 | #49 | Exceptional 1.6% |
| Celtics | 99.9 /100 | #50 | Exceptional 1.6% |
| Chippewa | 99.8 /100 | #51 | Exceptional 1.6% |
| Immigrants | Canada | 99.8 /100 | #52 | Exceptional 1.6% |
| Creek | 99.8 /100 | #53 | Exceptional 1.6% |
| Crow | 99.8 /100 | #54 | Exceptional 1.6% |
| Greeks | 99.8 /100 | #55 | Exceptional 1.6% |
| Immigrants | North America | 99.8 /100 | #56 | Exceptional 1.6% |
| Austrians | 99.8 /100 | #57 | Exceptional 1.6% |
Demographics Similar to Carpatho Rusyns by No Schooling Completed
In terms of no schooling completed, the demographic groups most similar to Carpatho Rusyns are Slovene (1.4%, a difference of 0.82%), English (1.4%, a difference of 0.97%), German (1.4%, a difference of 1.2%), Norwegian (1.3%, a difference of 1.8%), and Slovak (1.3%, a difference of 2.2%).
| Demographics | Rating | Rank | No Schooling Completed |
| Yup'ik | 100.0 /100 | #1 | Exceptional 1.2% |
| Slovaks | 100.0 /100 | #2 | Exceptional 1.3% |
| Norwegians | 100.0 /100 | #3 | Exceptional 1.3% |
| Germans | 100.0 /100 | #4 | Exceptional 1.4% |
| Slovenes | 100.0 /100 | #5 | Exceptional 1.4% |
| Carpatho Rusyns | 100.0 /100 | #6 | Exceptional 1.4% |
| English | 100.0 /100 | #7 | Exceptional 1.4% |
| Swedes | 100.0 /100 | #8 | Exceptional 1.4% |
| Scottish | 100.0 /100 | #9 | Exceptional 1.4% |
| Dutch | 100.0 /100 | #10 | Exceptional 1.4% |
| Lithuanians | 100.0 /100 | #11 | Exceptional 1.4% |
| Irish | 100.0 /100 | #12 | Exceptional 1.4% |
| Poles | 100.0 /100 | #13 | Exceptional 1.4% |
| Scotch-Irish | 100.0 /100 | #14 | Exceptional 1.5% |
| Tlingit-Haida | 100.0 /100 | #15 | Exceptional 1.5% |