Celtic vs Cuban Seniors Poverty Over the Age of 75
COMPARE
Celtic
Cuban
Seniors Poverty Over the Age of 75
Seniors Poverty Over the Age of 75 Comparison
Celtics
Cubans
11.0%
SENIORS POVERTY OVER THE AGE OF 75
99.1/ 100
METRIC RATING
43rd/ 347
METRIC RANK
18.0%
SENIORS POVERTY OVER THE AGE OF 75
0.0/ 100
METRIC RATING
335th/ 347
METRIC RANK
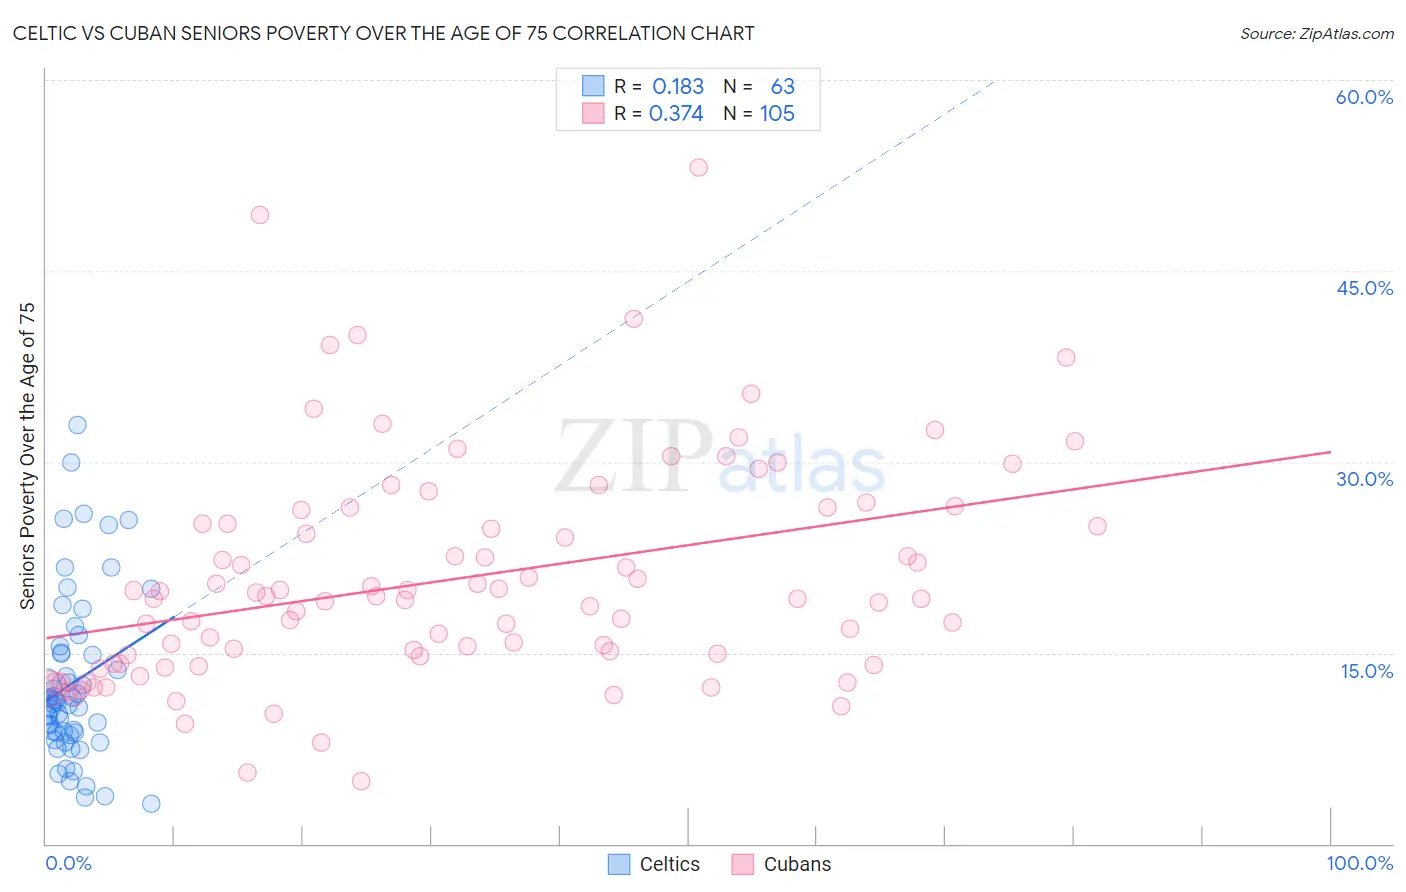
Celtic vs Cuban Seniors Poverty Over the Age of 75 Correlation Chart
The statistical analysis conducted on geographies consisting of 167,925,016 people shows a poor positive correlation between the proportion of Celtics and poverty level among seniors over the age of 75 in the United States with a correlation coefficient (R) of 0.183 and weighted average of 11.0%. Similarly, the statistical analysis conducted on geographies consisting of 443,347,202 people shows a mild positive correlation between the proportion of Cubans and poverty level among seniors over the age of 75 in the United States with a correlation coefficient (R) of 0.374 and weighted average of 18.0%, a difference of 62.9%.
Seniors Poverty Over the Age of 75 Correlation Summary
| Measurement | Celtic | Cuban |
| Minimum | 3.2% | 4.9% |
| Maximum | 32.9% | 53.2% |
| Range | 29.8% | 48.3% |
| Mean | 12.6% | 20.8% |
| Median | 11.1% | 19.2% |
| Interquartile 25% (IQ1) | 8.7% | 14.5% |
| Interquartile 75% (IQ3) | 15.0% | 25.7% |
| Interquartile Range (IQR) | 6.3% | 11.2% |
| Standard Deviation (Sample) | 6.5% | 8.7% |
| Standard Deviation (Population) | 6.4% | 8.7% |
Similar Demographics by Seniors Poverty Over the Age of 75
Demographics Similar to Celtics by Seniors Poverty Over the Age of 75
In terms of seniors poverty over the age of 75, the demographic groups most similar to Celtics are Belgian (11.0%, a difference of 0.030%), Austrian (11.0%, a difference of 0.050%), Carpatho Rusyn (11.1%, a difference of 0.30%), Immigrants from Lithuania (11.0%, a difference of 0.32%), and Greek (11.1%, a difference of 0.36%).
| Demographics | Rating | Rank | Seniors Poverty Over the Age of 75 |
| Scotch-Irish | 99.6 /100 | #36 | Exceptional 10.8% |
| Latvians | 99.6 /100 | #37 | Exceptional 10.8% |
| Finns | 99.6 /100 | #38 | Exceptional 10.8% |
| Czechoslovakians | 99.4 /100 | #39 | Exceptional 10.9% |
| Thais | 99.4 /100 | #40 | Exceptional 10.9% |
| Immigrants | Lithuania | 99.2 /100 | #41 | Exceptional 11.0% |
| Austrians | 99.1 /100 | #42 | Exceptional 11.0% |
| Celtics | 99.1 /100 | #43 | Exceptional 11.0% |
| Belgians | 99.1 /100 | #44 | Exceptional 11.0% |
| Carpatho Rusyns | 99.0 /100 | #45 | Exceptional 11.1% |
| Greeks | 99.0 /100 | #46 | Exceptional 11.1% |
| Hawaiians | 98.8 /100 | #47 | Exceptional 11.1% |
| French | 98.7 /100 | #48 | Exceptional 11.1% |
| Samoans | 98.7 /100 | #49 | Exceptional 11.1% |
| Serbians | 98.6 /100 | #50 | Exceptional 11.1% |
Demographics Similar to Cubans by Seniors Poverty Over the Age of 75
In terms of seniors poverty over the age of 75, the demographic groups most similar to Cubans are Immigrants from Grenada (17.8%, a difference of 0.59%), Immigrants from Caribbean (18.2%, a difference of 1.6%), Yakama (18.3%, a difference of 2.1%), Immigrants from Nicaragua (17.6%, a difference of 2.1%), and Immigrants from St. Vincent and the Grenadines (17.5%, a difference of 2.6%).
| Demographics | Rating | Rank | Seniors Poverty Over the Age of 75 |
| Cape Verdeans | 0.0 /100 | #328 | Tragic 16.8% |
| Immigrants | Dominica | 0.0 /100 | #329 | Tragic 17.0% |
| British West Indians | 0.0 /100 | #330 | Tragic 17.4% |
| Immigrants | Armenia | 0.0 /100 | #331 | Tragic 17.5% |
| Immigrants | St. Vincent and the Grenadines | 0.0 /100 | #332 | Tragic 17.5% |
| Immigrants | Nicaragua | 0.0 /100 | #333 | Tragic 17.6% |
| Immigrants | Grenada | 0.0 /100 | #334 | Tragic 17.8% |
| Cubans | 0.0 /100 | #335 | Tragic 18.0% |
| Immigrants | Caribbean | 0.0 /100 | #336 | Tragic 18.2% |
| Yakama | 0.0 /100 | #337 | Tragic 18.3% |
| Immigrants | Cabo Verde | 0.0 /100 | #338 | Tragic 18.5% |
| Hopi | 0.0 /100 | #339 | Tragic 18.9% |
| Tohono O'odham | 0.0 /100 | #340 | Tragic 19.1% |
| Navajo | 0.0 /100 | #341 | Tragic 19.4% |
| Dominicans | 0.0 /100 | #342 | Tragic 19.6% |