Celtic vs Cuban Male Unemployment
COMPARE
Celtic
Cuban
Male Unemployment
Male Unemployment Comparison
Celtics
Cubans
5.0%
MALE UNEMPLOYMENT
97.8/ 100
METRIC RATING
64th/ 347
METRIC RANK
4.6%
MALE UNEMPLOYMENT
100.0/ 100
METRIC RATING
10th/ 347
METRIC RANK
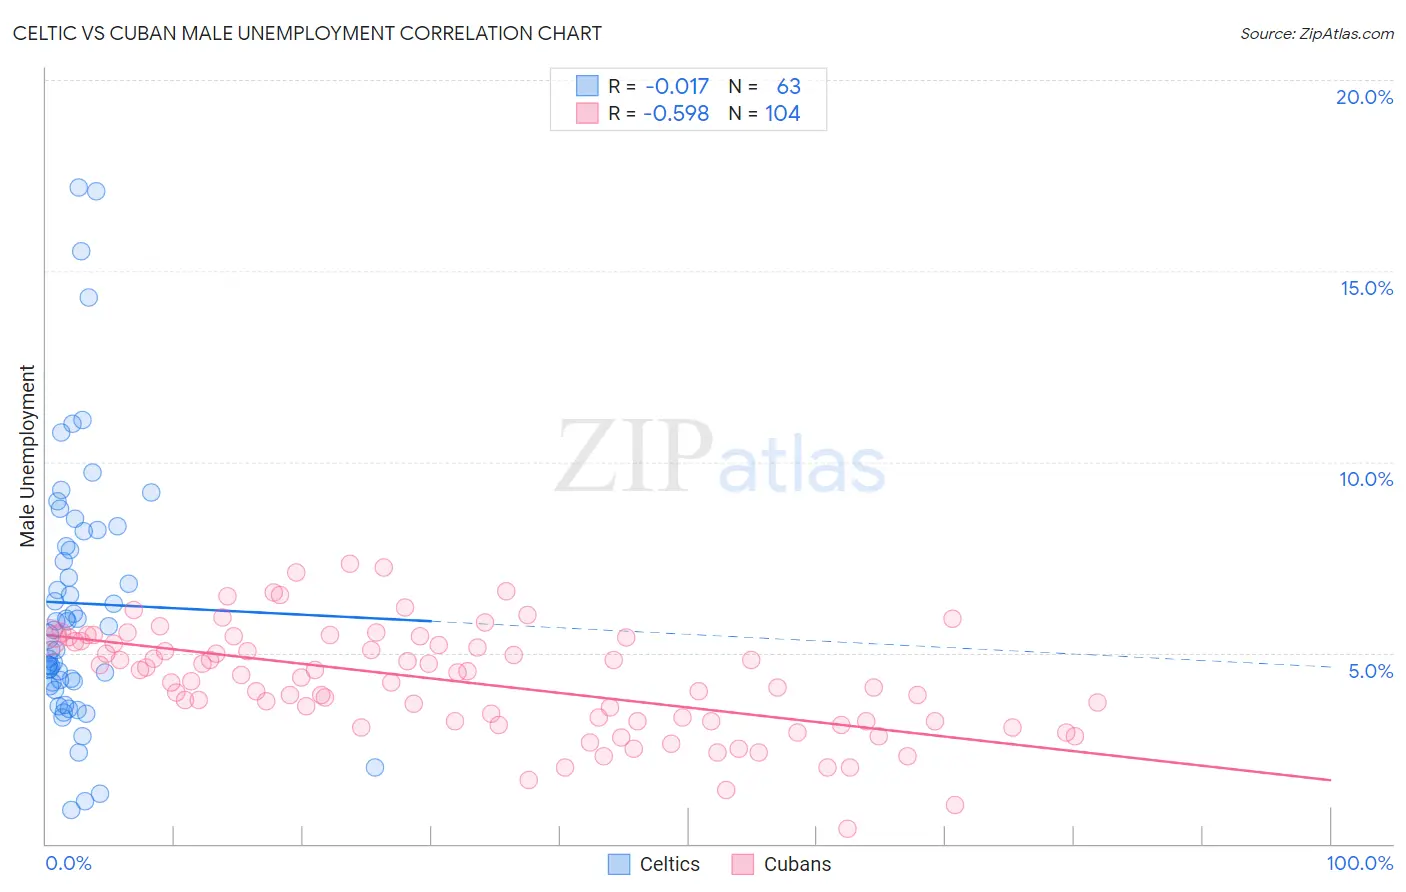
Celtic vs Cuban Male Unemployment Correlation Chart
The statistical analysis conducted on geographies consisting of 168,462,496 people shows no correlation between the proportion of Celtics and unemployment rate among males in the United States with a correlation coefficient (R) of -0.017 and weighted average of 5.0%. Similarly, the statistical analysis conducted on geographies consisting of 447,036,033 people shows a substantial negative correlation between the proportion of Cubans and unemployment rate among males in the United States with a correlation coefficient (R) of -0.598 and weighted average of 4.6%, a difference of 8.3%.
Male Unemployment Correlation Summary
| Measurement | Celtic | Cuban |
| Minimum | 0.90% | 0.40% |
| Maximum | 17.2% | 7.3% |
| Range | 16.3% | 6.9% |
| Mean | 6.3% | 4.3% |
| Median | 5.6% | 4.4% |
| Interquartile 25% (IQ1) | 4.2% | 3.2% |
| Interquartile 75% (IQ3) | 8.2% | 5.4% |
| Interquartile Range (IQR) | 4.0% | 2.2% |
| Standard Deviation (Sample) | 3.5% | 1.4% |
| Standard Deviation (Population) | 3.5% | 1.4% |
Similar Demographics by Male Unemployment
Demographics Similar to Celtics by Male Unemployment
In terms of male unemployment, the demographic groups most similar to Celtics are Eastern European (5.0%, a difference of 0.020%), Basque (5.0%, a difference of 0.030%), Cambodian (5.0%, a difference of 0.16%), Icelander (5.0%, a difference of 0.16%), and Immigrants from Argentina (5.0%, a difference of 0.24%).
| Demographics | Rating | Rank | Male Unemployment |
| Turks | 98.5 /100 | #57 | Exceptional 5.0% |
| Lithuanians | 98.5 /100 | #58 | Exceptional 5.0% |
| Immigrants | Netherlands | 98.3 /100 | #59 | Exceptional 5.0% |
| Immigrants | Argentina | 98.1 /100 | #60 | Exceptional 5.0% |
| Cambodians | 98.1 /100 | #61 | Exceptional 5.0% |
| Basques | 97.9 /100 | #62 | Exceptional 5.0% |
| Eastern Europeans | 97.9 /100 | #63 | Exceptional 5.0% |
| Celtics | 97.8 /100 | #64 | Exceptional 5.0% |
| Icelanders | 97.6 /100 | #65 | Exceptional 5.0% |
| Finns | 97.5 /100 | #66 | Exceptional 5.0% |
| Immigrants | Canada | 97.5 /100 | #67 | Exceptional 5.0% |
| Australians | 97.4 /100 | #68 | Exceptional 5.0% |
| Immigrants | Sweden | 97.4 /100 | #69 | Exceptional 5.0% |
| Whites/Caucasians | 97.3 /100 | #70 | Exceptional 5.0% |
| New Zealanders | 97.3 /100 | #71 | Exceptional 5.0% |
Demographics Similar to Cubans by Male Unemployment
In terms of male unemployment, the demographic groups most similar to Cubans are Swedish (4.6%, a difference of 0.20%), Thai (4.6%, a difference of 0.60%), Immigrants from Bolivia (4.7%, a difference of 0.93%), Bolivian (4.7%, a difference of 1.6%), and German (4.7%, a difference of 1.6%).
| Demographics | Rating | Rank | Male Unemployment |
| Norwegians | 100.0 /100 | #3 | Exceptional 4.4% |
| Immigrants | Venezuela | 100.0 /100 | #4 | Exceptional 4.4% |
| Danes | 100.0 /100 | #5 | Exceptional 4.5% |
| Venezuelans | 100.0 /100 | #6 | Exceptional 4.5% |
| Czechs | 100.0 /100 | #7 | Exceptional 4.5% |
| Luxembourgers | 100.0 /100 | #8 | Exceptional 4.5% |
| Thais | 100.0 /100 | #9 | Exceptional 4.6% |
| Cubans | 100.0 /100 | #10 | Exceptional 4.6% |
| Swedes | 100.0 /100 | #11 | Exceptional 4.6% |
| Immigrants | Bolivia | 100.0 /100 | #12 | Exceptional 4.7% |
| Bolivians | 100.0 /100 | #13 | Exceptional 4.7% |
| Germans | 100.0 /100 | #14 | Exceptional 4.7% |
| Scandinavians | 100.0 /100 | #15 | Exceptional 4.7% |
| Swiss | 99.9 /100 | #16 | Exceptional 4.7% |
| Filipinos | 99.9 /100 | #17 | Exceptional 4.7% |