Bangladeshi vs Soviet Union College, Under 1 year
COMPARE
Bangladeshi
Soviet Union
College, Under 1 year
College, Under 1 year Comparison
Bangladeshis
Soviet Union
61.4%
COLLEGE, UNDER 1 YEAR
0.4/ 100
METRIC RATING
256th/ 347
METRIC RANK
71.1%
COLLEGE, UNDER 1 YEAR
100.0/ 100
METRIC RATING
24th/ 347
METRIC RANK
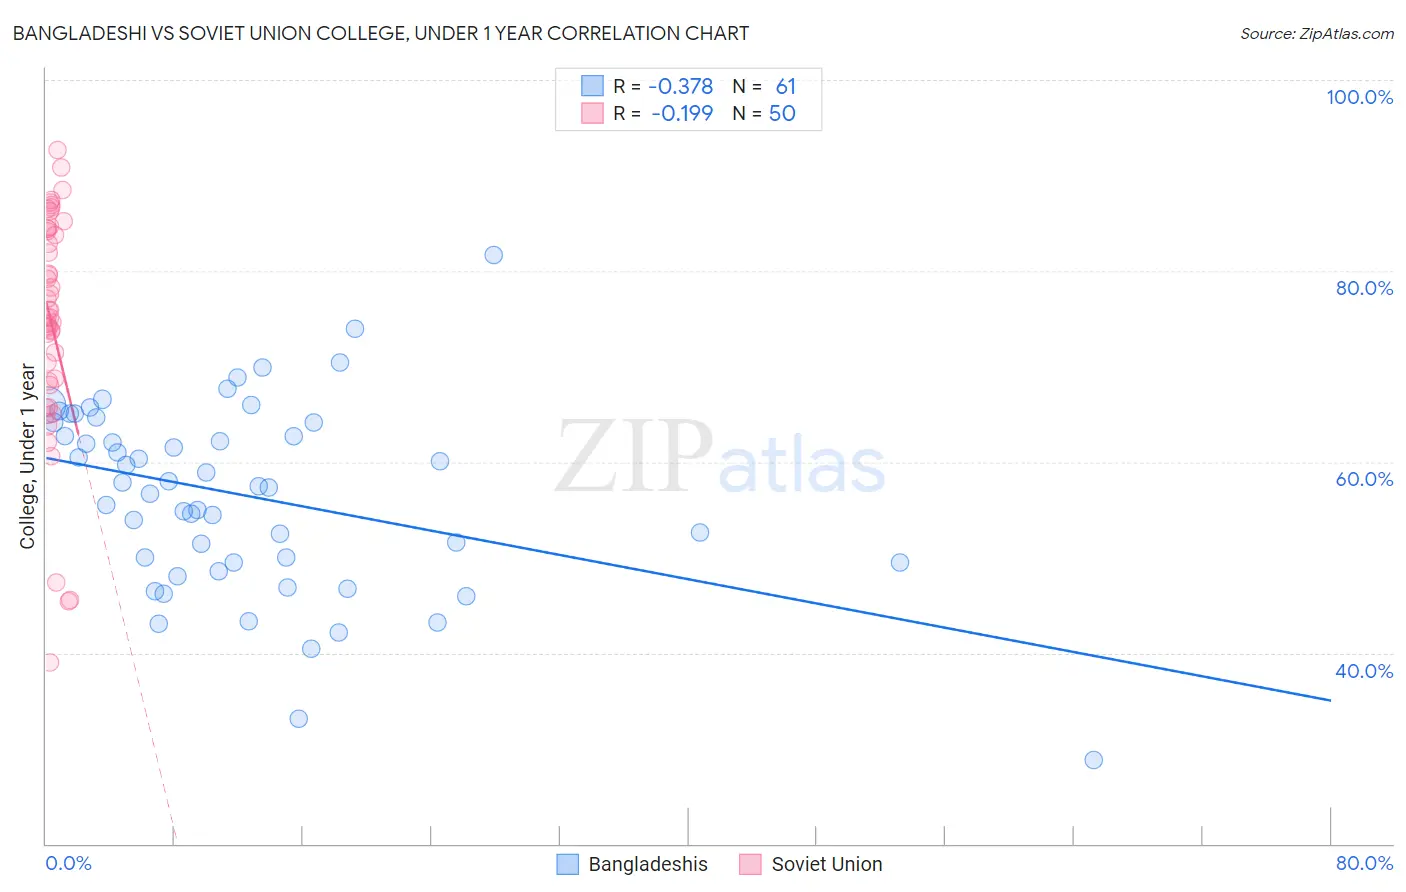
Bangladeshi vs Soviet Union College, Under 1 year Correlation Chart
The statistical analysis conducted on geographies consisting of 141,449,898 people shows a mild negative correlation between the proportion of Bangladeshis and percentage of population with at least college, under 1 year education in the United States with a correlation coefficient (R) of -0.378 and weighted average of 61.4%. Similarly, the statistical analysis conducted on geographies consisting of 43,514,626 people shows a poor negative correlation between the proportion of Soviet Union and percentage of population with at least college, under 1 year education in the United States with a correlation coefficient (R) of -0.199 and weighted average of 71.1%, a difference of 15.9%.
College, Under 1 year Correlation Summary
| Measurement | Bangladeshi | Soviet Union |
| Minimum | 28.8% | 39.0% |
| Maximum | 81.6% | 92.7% |
| Range | 52.9% | 53.7% |
| Mean | 56.4% | 74.6% |
| Median | 57.4% | 75.5% |
| Interquartile 25% (IQ1) | 49.5% | 68.4% |
| Interquartile 75% (IQ3) | 64.1% | 84.4% |
| Interquartile Range (IQR) | 14.7% | 16.0% |
| Standard Deviation (Sample) | 9.9% | 12.1% |
| Standard Deviation (Population) | 9.8% | 12.0% |
Similar Demographics by College, Under 1 year
Demographics Similar to Bangladeshis by College, Under 1 year
In terms of college, under 1 year, the demographic groups most similar to Bangladeshis are Comanche (61.4%, a difference of 0.040%), Immigrants from Laos (61.3%, a difference of 0.11%), West Indian (61.5%, a difference of 0.17%), Japanese (61.5%, a difference of 0.17%), and Immigrants from Cambodia (61.5%, a difference of 0.17%).
| Demographics | Rating | Rank | College, Under 1 year |
| Vietnamese | 0.5 /100 | #249 | Tragic 61.7% |
| Immigrants | Congo | 0.5 /100 | #250 | Tragic 61.7% |
| Immigrants | Micronesia | 0.5 /100 | #251 | Tragic 61.5% |
| West Indians | 0.4 /100 | #252 | Tragic 61.5% |
| Japanese | 0.4 /100 | #253 | Tragic 61.5% |
| Immigrants | Cambodia | 0.4 /100 | #254 | Tragic 61.5% |
| Comanche | 0.4 /100 | #255 | Tragic 61.4% |
| Bangladeshis | 0.4 /100 | #256 | Tragic 61.4% |
| Immigrants | Laos | 0.3 /100 | #257 | Tragic 61.3% |
| Immigrants | Bangladesh | 0.3 /100 | #258 | Tragic 61.3% |
| Indonesians | 0.3 /100 | #259 | Tragic 61.2% |
| Blackfeet | 0.3 /100 | #260 | Tragic 61.1% |
| Africans | 0.3 /100 | #261 | Tragic 61.1% |
| Barbadians | 0.2 /100 | #262 | Tragic 61.1% |
| Shoshone | 0.2 /100 | #263 | Tragic 61.1% |
Demographics Similar to Soviet Union by College, Under 1 year
In terms of college, under 1 year, the demographic groups most similar to Soviet Union are Immigrants from Northern Europe (71.1%, a difference of 0.010%), Bulgarian (71.1%, a difference of 0.020%), Immigrants from Denmark (71.0%, a difference of 0.13%), Immigrants from Ireland (71.0%, a difference of 0.14%), and Immigrants from Hong Kong (71.0%, a difference of 0.17%).
| Demographics | Rating | Rank | College, Under 1 year |
| Eastern Europeans | 100.0 /100 | #17 | Exceptional 71.8% |
| Immigrants | Switzerland | 100.0 /100 | #18 | Exceptional 71.7% |
| Latvians | 100.0 /100 | #19 | Exceptional 71.6% |
| Immigrants | Korea | 100.0 /100 | #20 | Exceptional 71.6% |
| Immigrants | Belgium | 100.0 /100 | #21 | Exceptional 71.5% |
| Immigrants | Eastern Asia | 100.0 /100 | #22 | Exceptional 71.3% |
| Immigrants | Northern Europe | 100.0 /100 | #23 | Exceptional 71.1% |
| Soviet Union | 100.0 /100 | #24 | Exceptional 71.1% |
| Bulgarians | 100.0 /100 | #25 | Exceptional 71.1% |
| Immigrants | Denmark | 100.0 /100 | #26 | Exceptional 71.0% |
| Immigrants | Ireland | 100.0 /100 | #27 | Exceptional 71.0% |
| Immigrants | Hong Kong | 100.0 /100 | #28 | Exceptional 71.0% |
| Immigrants | France | 100.0 /100 | #29 | Exceptional 71.0% |
| Immigrants | China | 99.9 /100 | #30 | Exceptional 70.9% |
| Indians (Asian) | 99.9 /100 | #31 | Exceptional 70.8% |