Cape Verdean vs Soviet Union Bachelor's Degree
COMPARE
Cape Verdean
Soviet Union
Bachelor's Degree
Bachelor's Degree Comparison
Cape Verdeans
Soviet Union
30.9%
BACHELOR'S DEGREE
0.1/ 100
METRIC RATING
293rd/ 347
METRIC RANK
47.9%
BACHELOR'S DEGREE
100.0/ 100
METRIC RATING
16th/ 347
METRIC RANK
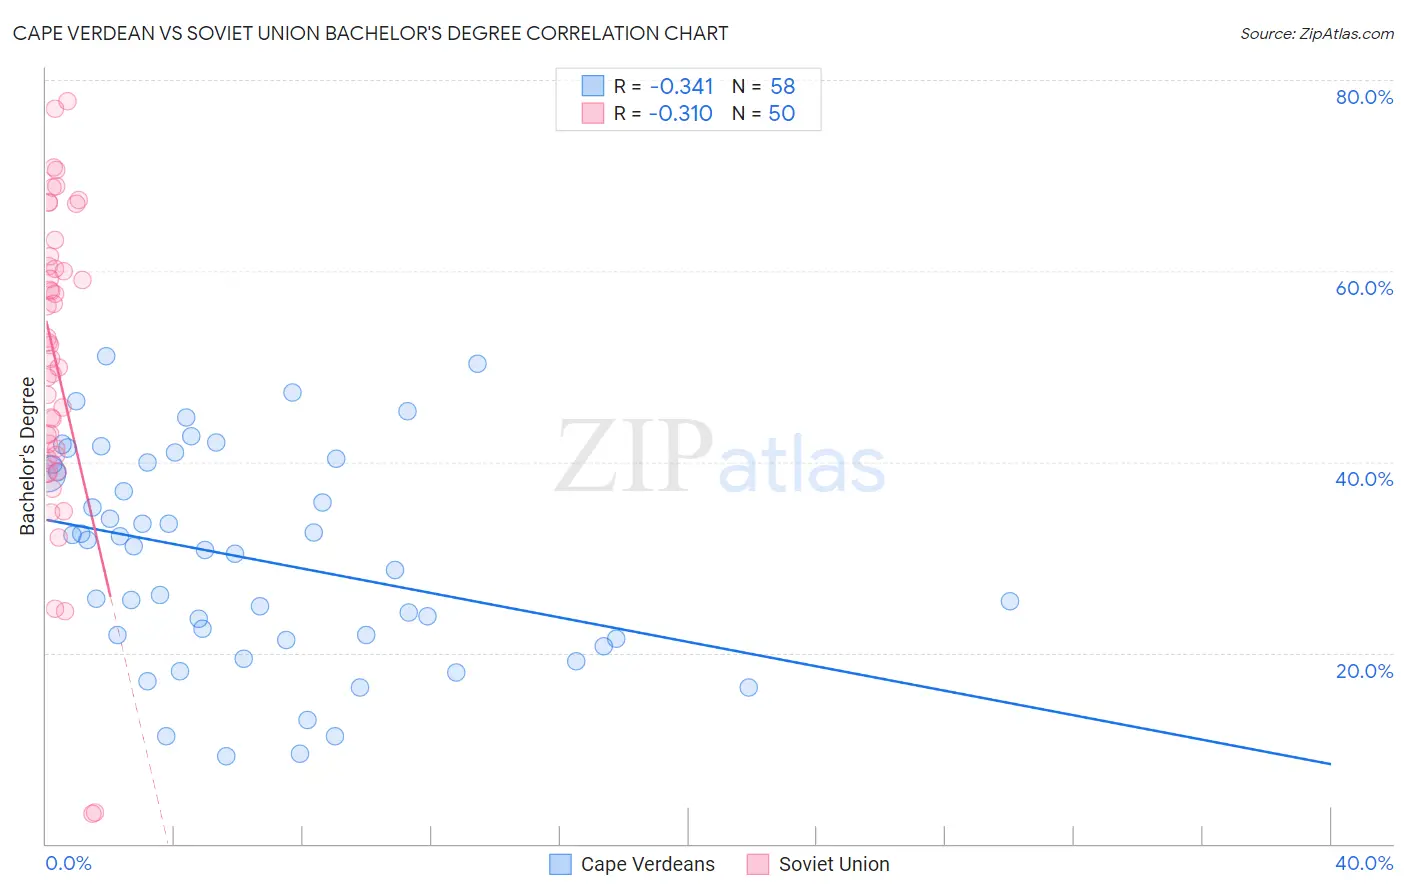
Cape Verdean vs Soviet Union Bachelor's Degree Correlation Chart
The statistical analysis conducted on geographies consisting of 107,579,192 people shows a mild negative correlation between the proportion of Cape Verdeans and percentage of population with at least bachelor's degree education in the United States with a correlation coefficient (R) of -0.341 and weighted average of 30.9%. Similarly, the statistical analysis conducted on geographies consisting of 43,514,626 people shows a mild negative correlation between the proportion of Soviet Union and percentage of population with at least bachelor's degree education in the United States with a correlation coefficient (R) of -0.310 and weighted average of 47.9%, a difference of 55.2%.
Bachelor's Degree Correlation Summary
| Measurement | Cape Verdean | Soviet Union |
| Minimum | 9.1% | 3.1% |
| Maximum | 51.0% | 77.7% |
| Range | 41.9% | 74.6% |
| Mean | 29.9% | 50.2% |
| Median | 31.0% | 51.5% |
| Interquartile 25% (IQ1) | 21.5% | 40.7% |
| Interquartile 75% (IQ3) | 39.7% | 60.5% |
| Interquartile Range (IQR) | 18.2% | 19.8% |
| Standard Deviation (Sample) | 11.0% | 16.2% |
| Standard Deviation (Population) | 10.9% | 16.0% |
Similar Demographics by Bachelor's Degree
Demographics Similar to Cape Verdeans by Bachelor's Degree
In terms of bachelor's degree, the demographic groups most similar to Cape Verdeans are Ute (30.9%, a difference of 0.090%), Black/African American (30.9%, a difference of 0.18%), Immigrants from Honduras (30.9%, a difference of 0.21%), Puerto Rican (31.0%, a difference of 0.26%), and Guatemalan (31.0%, a difference of 0.40%).
| Demographics | Rating | Rank | Bachelor's Degree |
| Immigrants | El Salvador | 0.1 /100 | #286 | Tragic 31.3% |
| Ottawa | 0.1 /100 | #287 | Tragic 31.1% |
| Guatemalans | 0.1 /100 | #288 | Tragic 31.0% |
| Puerto Ricans | 0.1 /100 | #289 | Tragic 31.0% |
| Immigrants | Honduras | 0.1 /100 | #290 | Tragic 30.9% |
| Blacks/African Americans | 0.1 /100 | #291 | Tragic 30.9% |
| Ute | 0.1 /100 | #292 | Tragic 30.9% |
| Cape Verdeans | 0.1 /100 | #293 | Tragic 30.9% |
| Immigrants | Guatemala | 0.0 /100 | #294 | Tragic 30.8% |
| Immigrants | Dominican Republic | 0.0 /100 | #295 | Tragic 30.7% |
| Puget Sound Salish | 0.0 /100 | #296 | Tragic 30.7% |
| Immigrants | Haiti | 0.0 /100 | #297 | Tragic 30.6% |
| Chippewa | 0.0 /100 | #298 | Tragic 30.6% |
| Chickasaw | 0.0 /100 | #299 | Tragic 30.4% |
| Immigrants | Micronesia | 0.0 /100 | #300 | Tragic 30.4% |
Demographics Similar to Soviet Union by Bachelor's Degree
In terms of bachelor's degree, the demographic groups most similar to Soviet Union are Immigrants from Eastern Asia (48.1%, a difference of 0.46%), Immigrants from Hong Kong (48.2%, a difference of 0.60%), Eastern European (47.5%, a difference of 0.86%), Immigrants from South Central Asia (48.3%, a difference of 0.88%), and Indian (Asian) (47.4%, a difference of 1.0%).
| Demographics | Rating | Rank | Bachelor's Degree |
| Immigrants | Israel | 100.0 /100 | #9 | Exceptional 50.0% |
| Cypriots | 100.0 /100 | #10 | Exceptional 49.0% |
| Immigrants | Australia | 100.0 /100 | #11 | Exceptional 48.5% |
| Immigrants | China | 100.0 /100 | #12 | Exceptional 48.4% |
| Immigrants | South Central Asia | 100.0 /100 | #13 | Exceptional 48.3% |
| Immigrants | Hong Kong | 100.0 /100 | #14 | Exceptional 48.2% |
| Immigrants | Eastern Asia | 100.0 /100 | #15 | Exceptional 48.1% |
| Soviet Union | 100.0 /100 | #16 | Exceptional 47.9% |
| Eastern Europeans | 100.0 /100 | #17 | Exceptional 47.5% |
| Indians (Asian) | 100.0 /100 | #18 | Exceptional 47.4% |
| Cambodians | 100.0 /100 | #19 | Exceptional 47.2% |
| Immigrants | Switzerland | 100.0 /100 | #20 | Exceptional 47.1% |
| Immigrants | Ireland | 100.0 /100 | #21 | Exceptional 47.1% |
| Immigrants | Belgium | 100.0 /100 | #22 | Exceptional 47.0% |
| Immigrants | Sweden | 100.0 /100 | #23 | Exceptional 47.0% |