Albanian vs Soviet Union College, Under 1 year
COMPARE
Albanian
Soviet Union
College, Under 1 year
College, Under 1 year Comparison
Albanians
Soviet Union
65.9%
COLLEGE, UNDER 1 YEAR
66.1/ 100
METRIC RATING
160th/ 347
METRIC RANK
71.1%
COLLEGE, UNDER 1 YEAR
100.0/ 100
METRIC RATING
24th/ 347
METRIC RANK
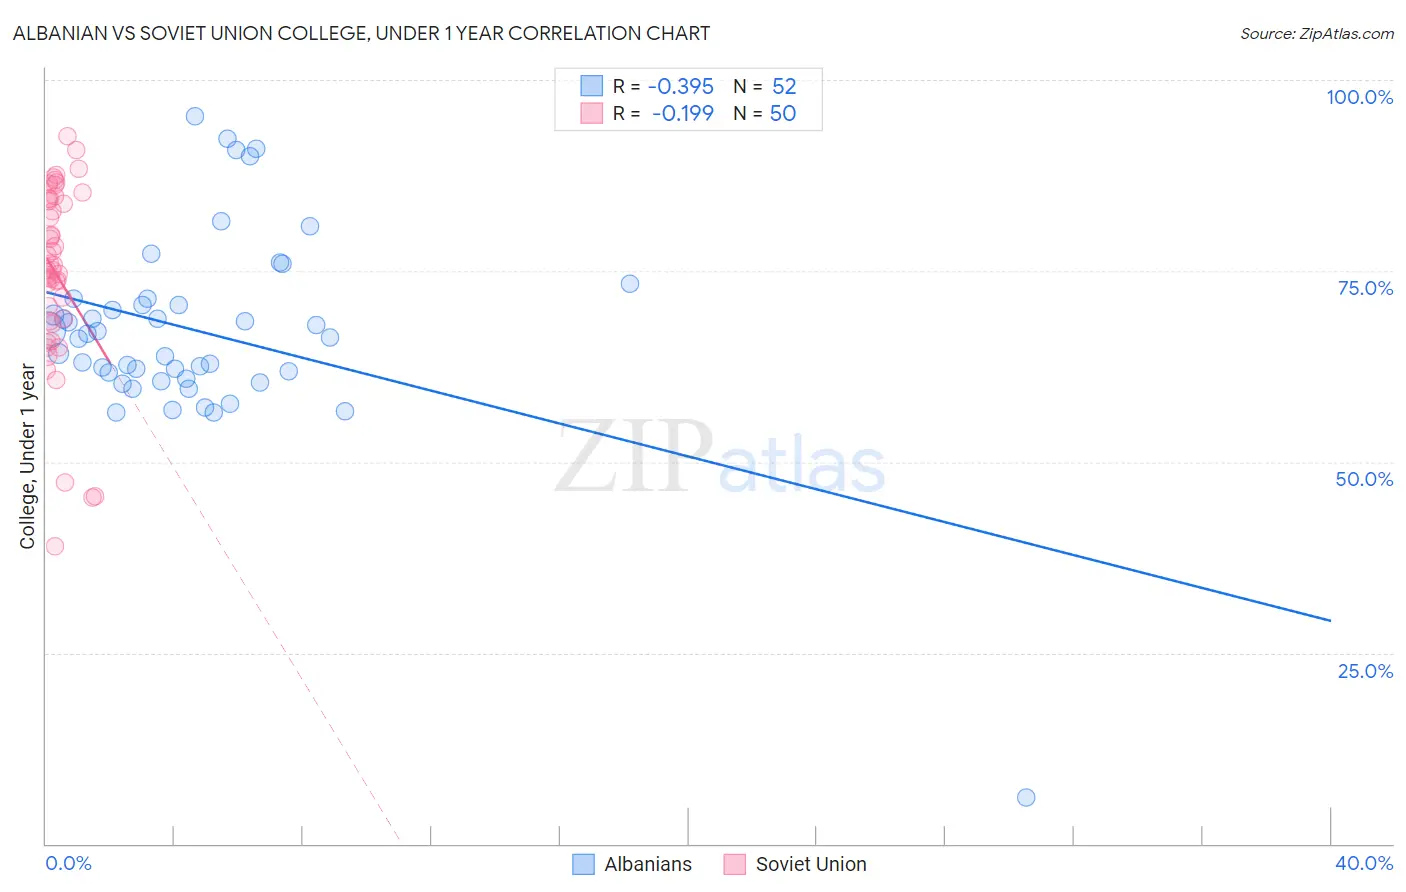
Albanian vs Soviet Union College, Under 1 year Correlation Chart
The statistical analysis conducted on geographies consisting of 193,265,850 people shows a mild negative correlation between the proportion of Albanians and percentage of population with at least college, under 1 year education in the United States with a correlation coefficient (R) of -0.395 and weighted average of 65.9%. Similarly, the statistical analysis conducted on geographies consisting of 43,514,626 people shows a poor negative correlation between the proportion of Soviet Union and percentage of population with at least college, under 1 year education in the United States with a correlation coefficient (R) of -0.199 and weighted average of 71.1%, a difference of 7.9%.
College, Under 1 year Correlation Summary
| Measurement | Albanian | Soviet Union |
| Minimum | 6.0% | 39.0% |
| Maximum | 95.3% | 92.7% |
| Range | 89.3% | 53.7% |
| Mean | 67.1% | 74.6% |
| Median | 66.5% | 75.5% |
| Interquartile 25% (IQ1) | 61.3% | 68.4% |
| Interquartile 75% (IQ3) | 70.9% | 84.4% |
| Interquartile Range (IQR) | 9.6% | 16.0% |
| Standard Deviation (Sample) | 13.1% | 12.1% |
| Standard Deviation (Population) | 13.0% | 12.0% |
Similar Demographics by College, Under 1 year
Demographics Similar to Albanians by College, Under 1 year
In terms of college, under 1 year, the demographic groups most similar to Albanians are Tlingit-Haida (65.9%, a difference of 0.010%), Brazilian (65.9%, a difference of 0.010%), Korean (65.9%, a difference of 0.040%), Celtic (65.9%, a difference of 0.060%), and Sierra Leonean (66.0%, a difference of 0.080%).
| Demographics | Rating | Rank | College, Under 1 year |
| Belgians | 73.7 /100 | #153 | Good 66.2% |
| Immigrants | Eritrea | 71.9 /100 | #154 | Good 66.1% |
| Irish | 70.3 /100 | #155 | Good 66.0% |
| Welsh | 69.9 /100 | #156 | Good 66.0% |
| Sierra Leoneans | 67.8 /100 | #157 | Good 66.0% |
| Celtics | 67.3 /100 | #158 | Good 65.9% |
| Tlingit-Haida | 66.4 /100 | #159 | Good 65.9% |
| Albanians | 66.1 /100 | #160 | Good 65.9% |
| Brazilians | 66.0 /100 | #161 | Good 65.9% |
| Koreans | 65.3 /100 | #162 | Good 65.9% |
| Somalis | 62.7 /100 | #163 | Good 65.8% |
| Czechoslovakians | 62.6 /100 | #164 | Good 65.8% |
| Immigrants | Uzbekistan | 61.6 /100 | #165 | Good 65.8% |
| Moroccans | 56.7 /100 | #166 | Average 65.6% |
| Immigrants | Somalia | 56.4 /100 | #167 | Average 65.6% |
Demographics Similar to Soviet Union by College, Under 1 year
In terms of college, under 1 year, the demographic groups most similar to Soviet Union are Immigrants from Northern Europe (71.1%, a difference of 0.010%), Bulgarian (71.1%, a difference of 0.020%), Immigrants from Denmark (71.0%, a difference of 0.13%), Immigrants from Ireland (71.0%, a difference of 0.14%), and Immigrants from Hong Kong (71.0%, a difference of 0.17%).
| Demographics | Rating | Rank | College, Under 1 year |
| Eastern Europeans | 100.0 /100 | #17 | Exceptional 71.8% |
| Immigrants | Switzerland | 100.0 /100 | #18 | Exceptional 71.7% |
| Latvians | 100.0 /100 | #19 | Exceptional 71.6% |
| Immigrants | Korea | 100.0 /100 | #20 | Exceptional 71.6% |
| Immigrants | Belgium | 100.0 /100 | #21 | Exceptional 71.5% |
| Immigrants | Eastern Asia | 100.0 /100 | #22 | Exceptional 71.3% |
| Immigrants | Northern Europe | 100.0 /100 | #23 | Exceptional 71.1% |
| Soviet Union | 100.0 /100 | #24 | Exceptional 71.1% |
| Bulgarians | 100.0 /100 | #25 | Exceptional 71.1% |
| Immigrants | Denmark | 100.0 /100 | #26 | Exceptional 71.0% |
| Immigrants | Ireland | 100.0 /100 | #27 | Exceptional 71.0% |
| Immigrants | Hong Kong | 100.0 /100 | #28 | Exceptional 71.0% |
| Immigrants | France | 100.0 /100 | #29 | Exceptional 71.0% |
| Immigrants | China | 99.9 /100 | #30 | Exceptional 70.9% |
| Indians (Asian) | 99.9 /100 | #31 | Exceptional 70.8% |