Immigrants from Southern Europe vs Soviet Union College, Under 1 year
COMPARE
Immigrants from Southern Europe
Soviet Union
College, Under 1 year
College, Under 1 year Comparison
Immigrants from Southern Europe
Soviet Union
64.9%
COLLEGE, UNDER 1 YEAR
34.3/ 100
METRIC RATING
187th/ 347
METRIC RANK
71.1%
COLLEGE, UNDER 1 YEAR
100.0/ 100
METRIC RATING
24th/ 347
METRIC RANK
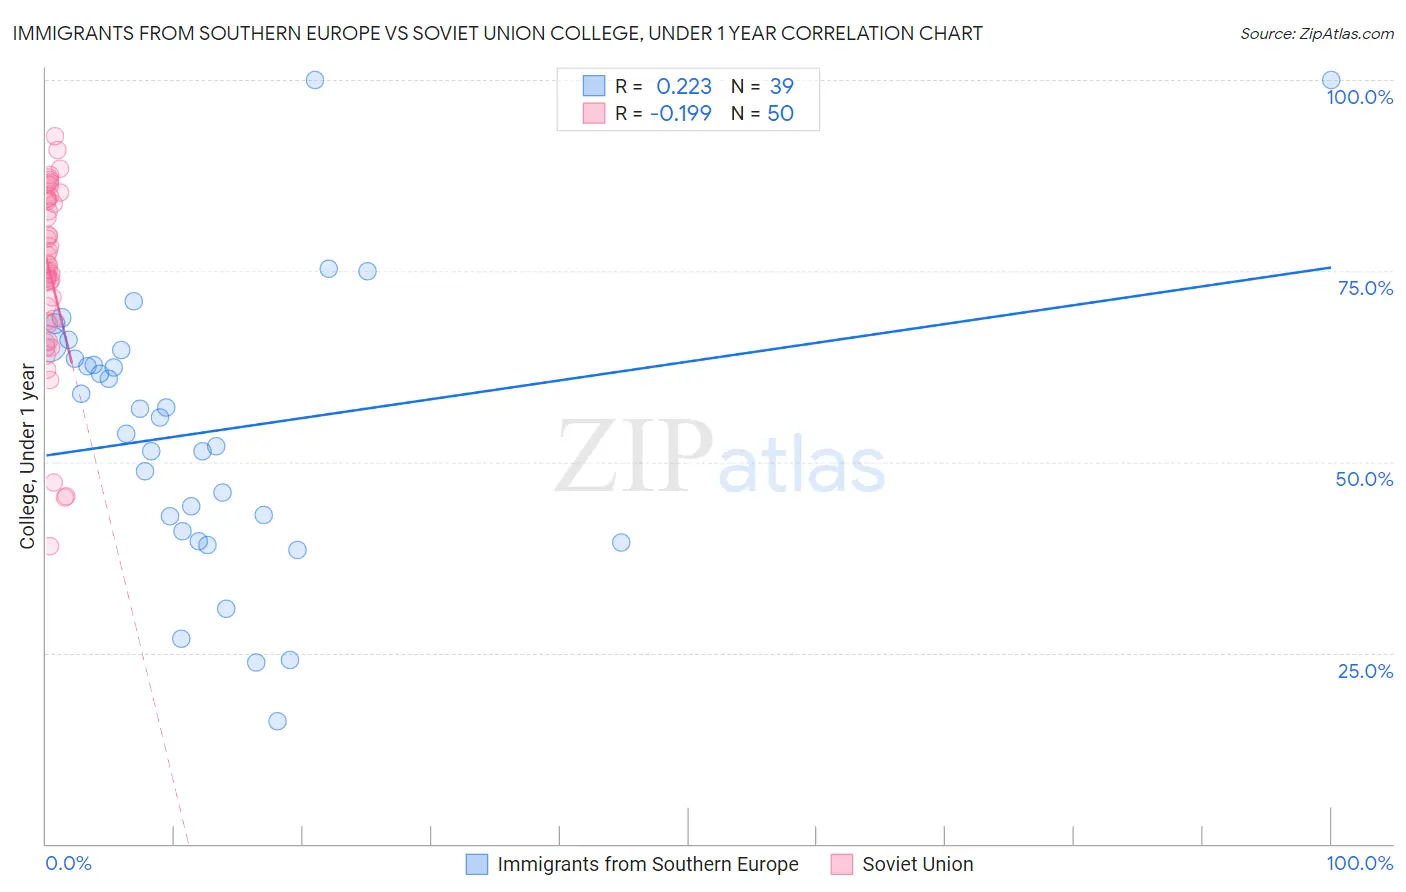
Immigrants from Southern Europe vs Soviet Union College, Under 1 year Correlation Chart
The statistical analysis conducted on geographies consisting of 402,801,573 people shows a weak positive correlation between the proportion of Immigrants from Southern Europe and percentage of population with at least college, under 1 year education in the United States with a correlation coefficient (R) of 0.223 and weighted average of 64.9%. Similarly, the statistical analysis conducted on geographies consisting of 43,514,626 people shows a poor negative correlation between the proportion of Soviet Union and percentage of population with at least college, under 1 year education in the United States with a correlation coefficient (R) of -0.199 and weighted average of 71.1%, a difference of 9.5%.
College, Under 1 year Correlation Summary
| Measurement | Immigrants from Southern Europe | Soviet Union |
| Minimum | 16.1% | 39.0% |
| Maximum | 100.0% | 92.7% |
| Range | 83.9% | 53.7% |
| Mean | 54.1% | 74.6% |
| Median | 55.8% | 75.5% |
| Interquartile 25% (IQ1) | 40.9% | 68.4% |
| Interquartile 75% (IQ3) | 64.6% | 84.4% |
| Interquartile Range (IQR) | 23.6% | 16.0% |
| Standard Deviation (Sample) | 18.3% | 12.1% |
| Standard Deviation (Population) | 18.1% | 12.0% |
Similar Demographics by College, Under 1 year
Demographics Similar to Immigrants from Southern Europe by College, Under 1 year
In terms of college, under 1 year, the demographic groups most similar to Immigrants from Southern Europe are Immigrants from Albania (64.9%, a difference of 0.11%), Spanish (64.9%, a difference of 0.14%), Immigrants from Philippines (64.8%, a difference of 0.21%), Immigrants from Sierra Leone (65.1%, a difference of 0.26%), and Immigrants from Armenia (64.7%, a difference of 0.32%).
| Demographics | Rating | Rank | College, Under 1 year |
| Dutch | 46.1 /100 | #180 | Average 65.3% |
| Spaniards | 45.5 /100 | #181 | Average 65.3% |
| Immigrants | Africa | 44.7 /100 | #182 | Average 65.3% |
| Immigrants | Poland | 42.6 /100 | #183 | Average 65.2% |
| Bermudans | 42.0 /100 | #184 | Average 65.2% |
| Sri Lankans | 41.7 /100 | #185 | Average 65.2% |
| Immigrants | Sierra Leone | 39.7 /100 | #186 | Fair 65.1% |
| Immigrants | Southern Europe | 34.3 /100 | #187 | Fair 64.9% |
| Immigrants | Albania | 32.0 /100 | #188 | Fair 64.9% |
| Spanish | 31.6 /100 | #189 | Fair 64.9% |
| Immigrants | Philippines | 30.1 /100 | #190 | Fair 64.8% |
| Immigrants | Armenia | 28.1 /100 | #191 | Fair 64.7% |
| Immigrants | Thailand | 27.0 /100 | #192 | Fair 64.7% |
| Slovaks | 26.7 /100 | #193 | Fair 64.7% |
| Immigrants | Cameroon | 24.6 /100 | #194 | Fair 64.6% |
Demographics Similar to Soviet Union by College, Under 1 year
In terms of college, under 1 year, the demographic groups most similar to Soviet Union are Immigrants from Northern Europe (71.1%, a difference of 0.010%), Bulgarian (71.1%, a difference of 0.020%), Immigrants from Denmark (71.0%, a difference of 0.13%), Immigrants from Ireland (71.0%, a difference of 0.14%), and Immigrants from Hong Kong (71.0%, a difference of 0.17%).
| Demographics | Rating | Rank | College, Under 1 year |
| Eastern Europeans | 100.0 /100 | #17 | Exceptional 71.8% |
| Immigrants | Switzerland | 100.0 /100 | #18 | Exceptional 71.7% |
| Latvians | 100.0 /100 | #19 | Exceptional 71.6% |
| Immigrants | Korea | 100.0 /100 | #20 | Exceptional 71.6% |
| Immigrants | Belgium | 100.0 /100 | #21 | Exceptional 71.5% |
| Immigrants | Eastern Asia | 100.0 /100 | #22 | Exceptional 71.3% |
| Immigrants | Northern Europe | 100.0 /100 | #23 | Exceptional 71.1% |
| Soviet Union | 100.0 /100 | #24 | Exceptional 71.1% |
| Bulgarians | 100.0 /100 | #25 | Exceptional 71.1% |
| Immigrants | Denmark | 100.0 /100 | #26 | Exceptional 71.0% |
| Immigrants | Ireland | 100.0 /100 | #27 | Exceptional 71.0% |
| Immigrants | Hong Kong | 100.0 /100 | #28 | Exceptional 71.0% |
| Immigrants | France | 100.0 /100 | #29 | Exceptional 71.0% |
| Immigrants | China | 99.9 /100 | #30 | Exceptional 70.9% |
| Indians (Asian) | 99.9 /100 | #31 | Exceptional 70.8% |