Dutch West Indian vs Soviet Union College, Under 1 year
COMPARE
Dutch West Indian
Soviet Union
College, Under 1 year
College, Under 1 year Comparison
Dutch West Indians
Soviet Union
57.2%
COLLEGE, UNDER 1 YEAR
0.0/ 100
METRIC RATING
313th/ 347
METRIC RANK
71.1%
COLLEGE, UNDER 1 YEAR
100.0/ 100
METRIC RATING
24th/ 347
METRIC RANK
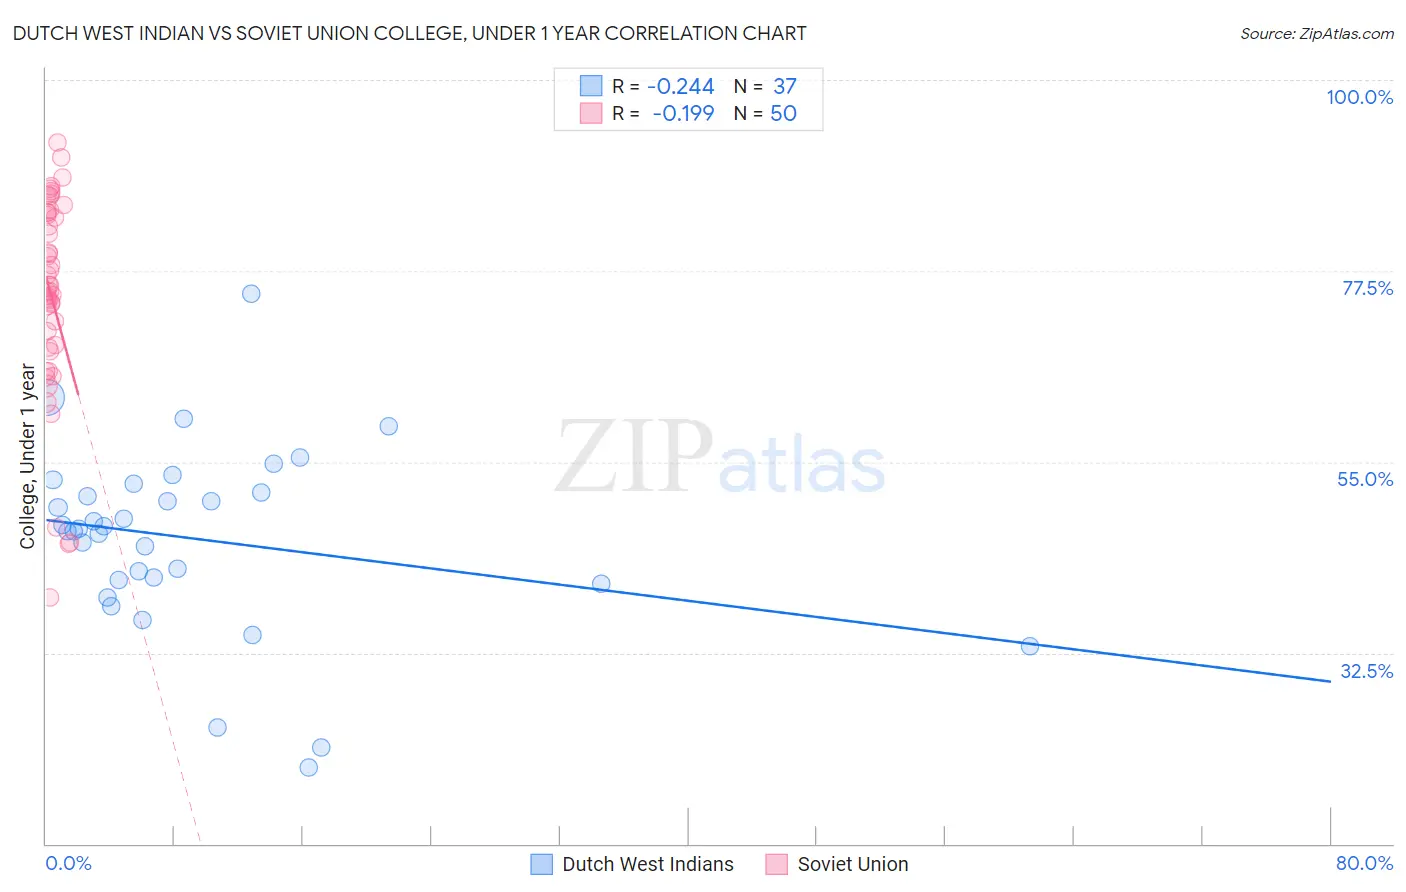
Dutch West Indian vs Soviet Union College, Under 1 year Correlation Chart
The statistical analysis conducted on geographies consisting of 85,776,067 people shows a weak negative correlation between the proportion of Dutch West Indians and percentage of population with at least college, under 1 year education in the United States with a correlation coefficient (R) of -0.244 and weighted average of 57.2%. Similarly, the statistical analysis conducted on geographies consisting of 43,514,626 people shows a poor negative correlation between the proportion of Soviet Union and percentage of population with at least college, under 1 year education in the United States with a correlation coefficient (R) of -0.199 and weighted average of 71.1%, a difference of 24.4%.
College, Under 1 year Correlation Summary
| Measurement | Dutch West Indian | Soviet Union |
| Minimum | 19.0% | 39.0% |
| Maximum | 74.8% | 92.7% |
| Range | 55.8% | 53.7% |
| Mean | 45.9% | 74.6% |
| Median | 47.1% | 75.5% |
| Interquartile 25% (IQ1) | 40.9% | 68.4% |
| Interquartile 75% (IQ3) | 51.9% | 84.4% |
| Interquartile Range (IQR) | 11.1% | 16.0% |
| Standard Deviation (Sample) | 11.0% | 12.1% |
| Standard Deviation (Population) | 10.8% | 12.0% |
Similar Demographics by College, Under 1 year
Demographics Similar to Dutch West Indians by College, Under 1 year
In terms of college, under 1 year, the demographic groups most similar to Dutch West Indians are Hopi (57.1%, a difference of 0.12%), Honduran (57.1%, a difference of 0.16%), Menominee (57.0%, a difference of 0.22%), Salvadoran (57.3%, a difference of 0.24%), and Hispanic or Latino (57.0%, a difference of 0.26%).
| Demographics | Rating | Rank | College, Under 1 year |
| Immigrants | Portugal | 0.0 /100 | #306 | Tragic 57.7% |
| Fijians | 0.0 /100 | #307 | Tragic 57.7% |
| Central Americans | 0.0 /100 | #308 | Tragic 57.7% |
| Immigrants | Nicaragua | 0.0 /100 | #309 | Tragic 57.6% |
| Pueblo | 0.0 /100 | #310 | Tragic 57.4% |
| Cajuns | 0.0 /100 | #311 | Tragic 57.3% |
| Salvadorans | 0.0 /100 | #312 | Tragic 57.3% |
| Dutch West Indians | 0.0 /100 | #313 | Tragic 57.2% |
| Hopi | 0.0 /100 | #314 | Tragic 57.1% |
| Hondurans | 0.0 /100 | #315 | Tragic 57.1% |
| Menominee | 0.0 /100 | #316 | Tragic 57.0% |
| Hispanics or Latinos | 0.0 /100 | #317 | Tragic 57.0% |
| Immigrants | Haiti | 0.0 /100 | #318 | Tragic 56.9% |
| Puerto Ricans | 0.0 /100 | #319 | Tragic 56.8% |
| Guatemalans | 0.0 /100 | #320 | Tragic 56.8% |
Demographics Similar to Soviet Union by College, Under 1 year
In terms of college, under 1 year, the demographic groups most similar to Soviet Union are Immigrants from Northern Europe (71.1%, a difference of 0.010%), Bulgarian (71.1%, a difference of 0.020%), Immigrants from Denmark (71.0%, a difference of 0.13%), Immigrants from Ireland (71.0%, a difference of 0.14%), and Immigrants from Hong Kong (71.0%, a difference of 0.17%).
| Demographics | Rating | Rank | College, Under 1 year |
| Eastern Europeans | 100.0 /100 | #17 | Exceptional 71.8% |
| Immigrants | Switzerland | 100.0 /100 | #18 | Exceptional 71.7% |
| Latvians | 100.0 /100 | #19 | Exceptional 71.6% |
| Immigrants | Korea | 100.0 /100 | #20 | Exceptional 71.6% |
| Immigrants | Belgium | 100.0 /100 | #21 | Exceptional 71.5% |
| Immigrants | Eastern Asia | 100.0 /100 | #22 | Exceptional 71.3% |
| Immigrants | Northern Europe | 100.0 /100 | #23 | Exceptional 71.1% |
| Soviet Union | 100.0 /100 | #24 | Exceptional 71.1% |
| Bulgarians | 100.0 /100 | #25 | Exceptional 71.1% |
| Immigrants | Denmark | 100.0 /100 | #26 | Exceptional 71.0% |
| Immigrants | Ireland | 100.0 /100 | #27 | Exceptional 71.0% |
| Immigrants | Hong Kong | 100.0 /100 | #28 | Exceptional 71.0% |
| Immigrants | France | 100.0 /100 | #29 | Exceptional 71.0% |
| Immigrants | China | 99.9 /100 | #30 | Exceptional 70.9% |
| Indians (Asian) | 99.9 /100 | #31 | Exceptional 70.8% |