Albanian vs Menominee College, 1 year or more
COMPARE
Albanian
Menominee
College, 1 year or more
College, 1 year or more Comparison
Albanians
Menominee
60.4%
COLLEGE, 1 YEAR OR MORE
77.8/ 100
METRIC RATING
151st/ 347
METRIC RANK
50.6%
COLLEGE, 1 YEAR OR MORE
0.0/ 100
METRIC RATING
327th/ 347
METRIC RANK
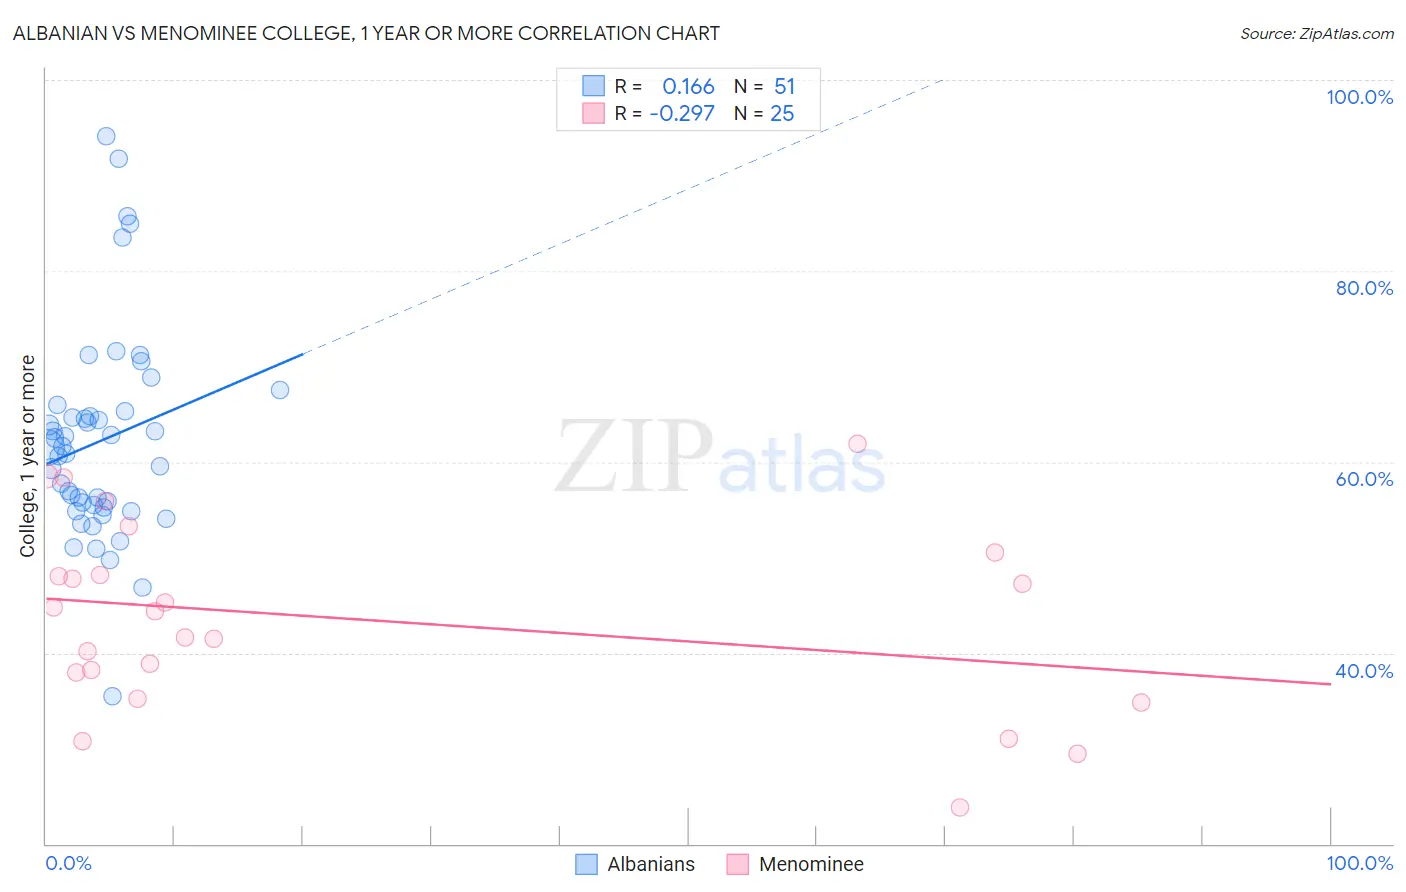
Albanian vs Menominee College, 1 year or more Correlation Chart
The statistical analysis conducted on geographies consisting of 193,265,709 people shows a poor positive correlation between the proportion of Albanians and percentage of population with at least college, 1 year or more education in the United States with a correlation coefficient (R) of 0.166 and weighted average of 60.4%. Similarly, the statistical analysis conducted on geographies consisting of 45,778,860 people shows a weak negative correlation between the proportion of Menominee and percentage of population with at least college, 1 year or more education in the United States with a correlation coefficient (R) of -0.297 and weighted average of 50.6%, a difference of 19.5%.
College, 1 year or more Correlation Summary
| Measurement | Albanian | Menominee |
| Minimum | 35.4% | 23.8% |
| Maximum | 94.1% | 61.9% |
| Range | 58.7% | 38.1% |
| Mean | 62.2% | 43.5% |
| Median | 61.5% | 44.3% |
| Interquartile 25% (IQ1) | 55.2% | 36.6% |
| Interquartile 75% (IQ3) | 65.3% | 49.3% |
| Interquartile Range (IQR) | 10.1% | 12.7% |
| Standard Deviation (Sample) | 11.0% | 9.8% |
| Standard Deviation (Population) | 10.9% | 9.6% |
Similar Demographics by College, 1 year or more
Demographics Similar to Albanians by College, 1 year or more
In terms of college, 1 year or more, the demographic groups most similar to Albanians are Immigrants from Sudan (60.4%, a difference of 0.0%), Kenyan (60.5%, a difference of 0.090%), Brazilian (60.5%, a difference of 0.090%), Immigrants from Kenya (60.5%, a difference of 0.10%), and Immigrants from Germany (60.3%, a difference of 0.13%).
| Demographics | Rating | Rank | College, 1 year or more |
| Czechs | 81.9 /100 | #144 | Excellent 60.6% |
| Slavs | 81.1 /100 | #145 | Excellent 60.6% |
| Scottish | 80.2 /100 | #146 | Excellent 60.5% |
| Immigrants | Kenya | 79.1 /100 | #147 | Good 60.5% |
| Kenyans | 79.0 /100 | #148 | Good 60.5% |
| Brazilians | 79.0 /100 | #149 | Good 60.5% |
| Immigrants | Sudan | 77.8 /100 | #150 | Good 60.4% |
| Albanians | 77.8 /100 | #151 | Good 60.4% |
| Immigrants | Germany | 76.1 /100 | #152 | Good 60.3% |
| Sierra Leoneans | 74.1 /100 | #153 | Good 60.2% |
| Sudanese | 73.0 /100 | #154 | Good 60.2% |
| Moroccans | 72.9 /100 | #155 | Good 60.2% |
| Finns | 72.9 /100 | #156 | Good 60.2% |
| Immigrants | Armenia | 68.8 /100 | #157 | Good 60.0% |
| English | 67.2 /100 | #158 | Good 60.0% |
Demographics Similar to Menominee by College, 1 year or more
In terms of college, 1 year or more, the demographic groups most similar to Menominee are Dominican (50.6%, a difference of 0.040%), Dutch West Indian (50.5%, a difference of 0.12%), Immigrants from Latin America (50.7%, a difference of 0.22%), Immigrants from Cuba (50.7%, a difference of 0.25%), and Immigrants from Guatemala (50.7%, a difference of 0.26%).
| Demographics | Rating | Rank | College, 1 year or more |
| Kiowa | 0.0 /100 | #320 | Tragic 51.0% |
| Hopi | 0.0 /100 | #321 | Tragic 50.9% |
| Navajo | 0.0 /100 | #322 | Tragic 50.8% |
| Immigrants | Guatemala | 0.0 /100 | #323 | Tragic 50.7% |
| Immigrants | Cuba | 0.0 /100 | #324 | Tragic 50.7% |
| Immigrants | Latin America | 0.0 /100 | #325 | Tragic 50.7% |
| Dominicans | 0.0 /100 | #326 | Tragic 50.6% |
| Menominee | 0.0 /100 | #327 | Tragic 50.6% |
| Dutch West Indians | 0.0 /100 | #328 | Tragic 50.5% |
| Cape Verdeans | 0.0 /100 | #329 | Tragic 50.3% |
| Natives/Alaskans | 0.0 /100 | #330 | Tragic 50.2% |
| Immigrants | Yemen | 0.0 /100 | #331 | Tragic 50.0% |
| Mexicans | 0.0 /100 | #332 | Tragic 49.2% |
| Immigrants | Dominican Republic | 0.0 /100 | #333 | Tragic 49.1% |
| Lumbee | 0.0 /100 | #334 | Tragic 48.9% |