Canadian vs Menominee 10th Grade
COMPARE
Canadian
Menominee
10th Grade
10th Grade Comparison
Canadians
Menominee
94.9%
10TH GRADE
99.6/ 100
METRIC RATING
74th/ 347
METRIC RANK
94.6%
10TH GRADE
98.3/ 100
METRIC RATING
95th/ 347
METRIC RANK
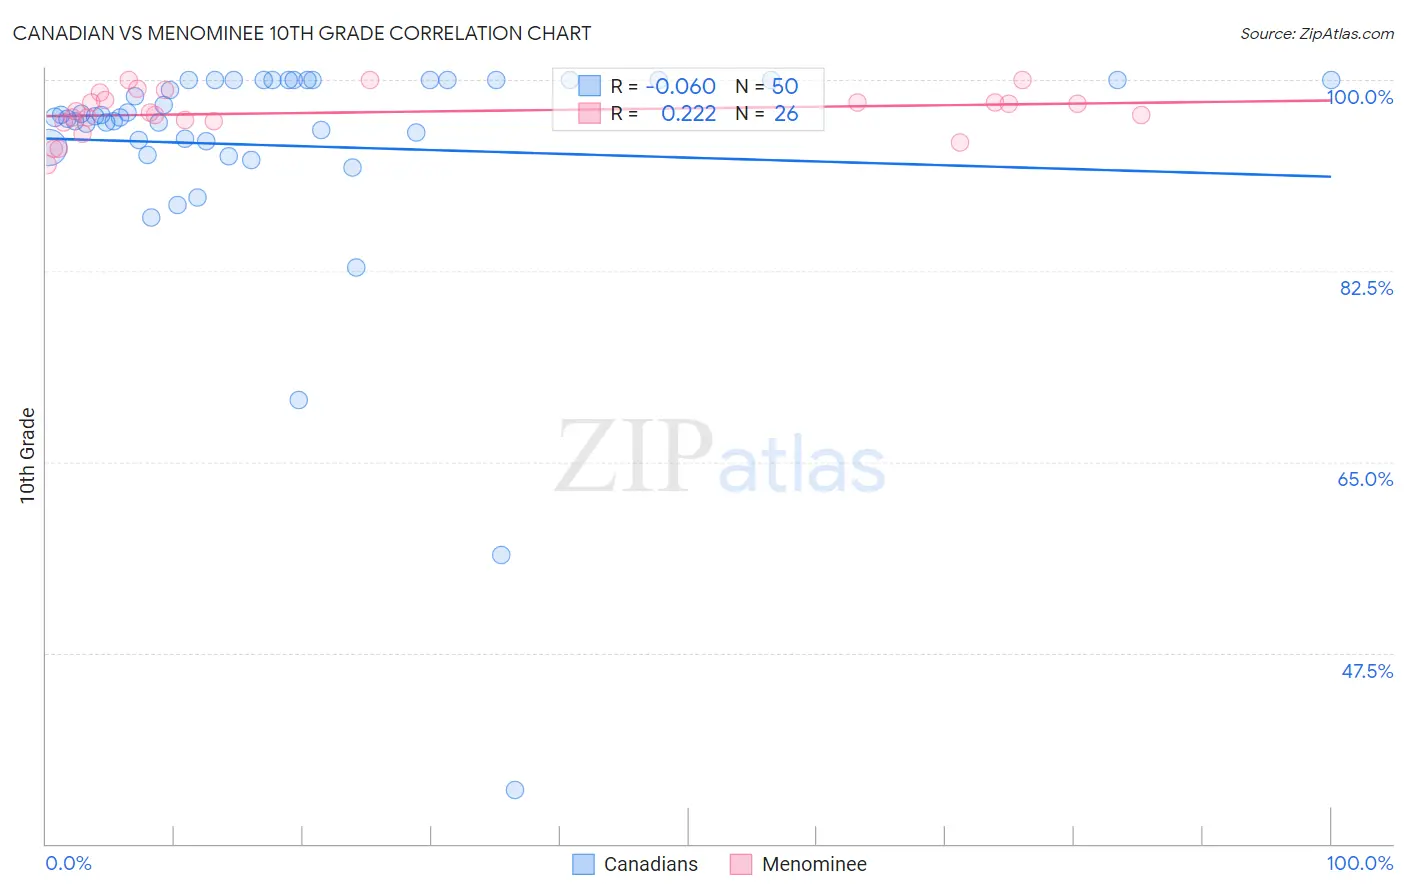
Canadian vs Menominee 10th Grade Correlation Chart
The statistical analysis conducted on geographies consisting of 437,556,598 people shows a slight negative correlation between the proportion of Canadians and percentage of population with at least 10th grade education in the United States with a correlation coefficient (R) of -0.060 and weighted average of 94.9%. Similarly, the statistical analysis conducted on geographies consisting of 45,778,979 people shows a weak positive correlation between the proportion of Menominee and percentage of population with at least 10th grade education in the United States with a correlation coefficient (R) of 0.222 and weighted average of 94.6%, a difference of 0.31%.
10th Grade Correlation Summary
| Measurement | Canadian | Menominee |
| Minimum | 34.9% | 92.2% |
| Maximum | 100.0% | 100.0% |
| Range | 65.1% | 7.8% |
| Mean | 94.0% | 97.0% |
| Median | 96.6% | 97.1% |
| Interquartile 25% (IQ1) | 94.4% | 96.2% |
| Interquartile 75% (IQ3) | 100.0% | 98.2% |
| Interquartile Range (IQR) | 5.6% | 2.0% |
| Standard Deviation (Sample) | 11.5% | 2.0% |
| Standard Deviation (Population) | 11.3% | 2.0% |
Similar Demographics by 10th Grade
Demographics Similar to Canadians by 10th Grade
In terms of 10th grade, the demographic groups most similar to Canadians are Bhutanese (94.9%, a difference of 0.0%), Immigrants from Sweden (94.9%, a difference of 0.010%), Alaska Native (94.9%, a difference of 0.020%), Zimbabwean (94.9%, a difference of 0.030%), and Okinawan (94.8%, a difference of 0.030%).
| Demographics | Rating | Rank | 10th Grade |
| Immigrants | Netherlands | 99.7 /100 | #67 | Exceptional 94.9% |
| Immigrants | Belgium | 99.7 /100 | #68 | Exceptional 94.9% |
| Immigrants | England | 99.6 /100 | #69 | Exceptional 94.9% |
| Zimbabweans | 99.6 /100 | #70 | Exceptional 94.9% |
| Alaska Natives | 99.6 /100 | #71 | Exceptional 94.9% |
| Immigrants | Sweden | 99.6 /100 | #72 | Exceptional 94.9% |
| Bhutanese | 99.6 /100 | #73 | Exceptional 94.9% |
| Canadians | 99.6 /100 | #74 | Exceptional 94.9% |
| Okinawans | 99.5 /100 | #75 | Exceptional 94.8% |
| Romanians | 99.5 /100 | #76 | Exceptional 94.8% |
| Immigrants | South Africa | 99.5 /100 | #77 | Exceptional 94.8% |
| Filipinos | 99.3 /100 | #78 | Exceptional 94.8% |
| Immigrants | Czechoslovakia | 99.2 /100 | #79 | Exceptional 94.7% |
| Immigrants | Denmark | 99.2 /100 | #80 | Exceptional 94.7% |
| Immigrants | Latvia | 99.2 /100 | #81 | Exceptional 94.7% |
Demographics Similar to Menominee by 10th Grade
In terms of 10th grade, the demographic groups most similar to Menominee are Immigrants from Germany (94.6%, a difference of 0.0%), Immigrants from Switzerland (94.6%, a difference of 0.0%), Lebanese (94.6%, a difference of 0.0%), Yugoslavian (94.6%, a difference of 0.010%), and Soviet Union (94.6%, a difference of 0.010%).
| Demographics | Rating | Rank | 10th Grade |
| Immigrants | Japan | 99.0 /100 | #88 | Exceptional 94.7% |
| Immigrants | Moldova | 98.9 /100 | #89 | Exceptional 94.7% |
| South Africans | 98.8 /100 | #90 | Exceptional 94.7% |
| Whites/Caucasians | 98.8 /100 | #91 | Exceptional 94.7% |
| Yugoslavians | 98.4 /100 | #92 | Exceptional 94.6% |
| Soviet Union | 98.3 /100 | #93 | Exceptional 94.6% |
| Immigrants | Germany | 98.3 /100 | #94 | Exceptional 94.6% |
| Menominee | 98.3 /100 | #95 | Exceptional 94.6% |
| Immigrants | Switzerland | 98.3 /100 | #96 | Exceptional 94.6% |
| Lebanese | 98.3 /100 | #97 | Exceptional 94.6% |
| Immigrants | Bulgaria | 98.1 /100 | #98 | Exceptional 94.6% |
| Immigrants | France | 97.9 /100 | #99 | Exceptional 94.5% |
| Immigrants | South Central Asia | 97.8 /100 | #100 | Exceptional 94.5% |
| Syrians | 97.7 /100 | #101 | Exceptional 94.5% |
| Cambodians | 97.6 /100 | #102 | Exceptional 94.5% |