Canadian vs Menominee Median Earnings
COMPARE
Canadian
Menominee
Median Earnings
Median Earnings Comparison
Canadians
Menominee
$47,911
MEDIAN EARNINGS
88.8/ 100
METRIC RATING
139th/ 347
METRIC RANK
$37,884
MEDIAN EARNINGS
0.0/ 100
METRIC RATING
339th/ 347
METRIC RANK
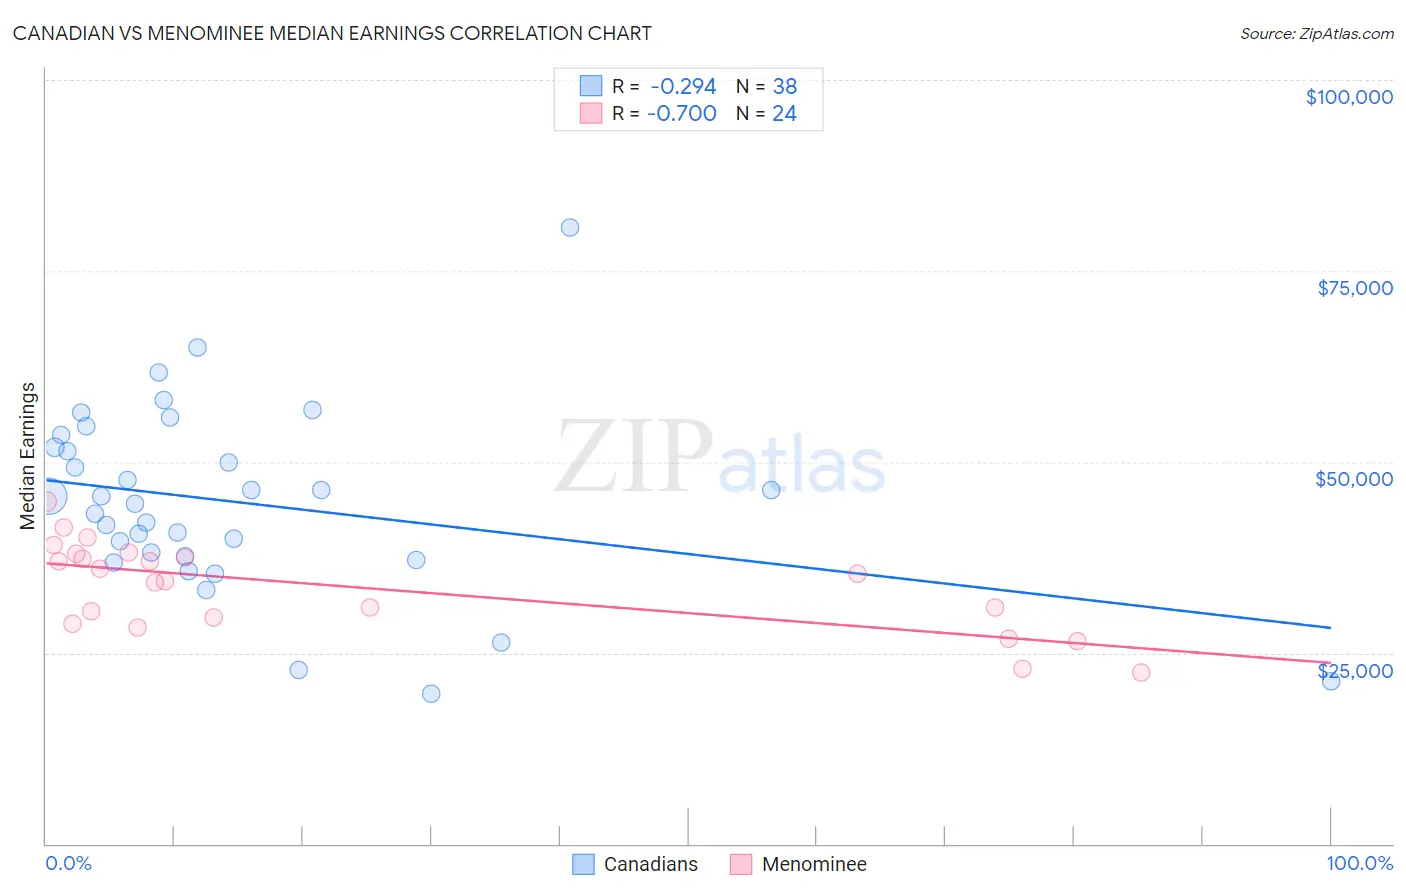
Canadian vs Menominee Median Earnings Correlation Chart
The statistical analysis conducted on geographies consisting of 437,494,547 people shows a weak negative correlation between the proportion of Canadians and median earnings in the United States with a correlation coefficient (R) of -0.294 and weighted average of $47,911. Similarly, the statistical analysis conducted on geographies consisting of 45,778,612 people shows a strong negative correlation between the proportion of Menominee and median earnings in the United States with a correlation coefficient (R) of -0.700 and weighted average of $37,884, a difference of 26.5%.
Median Earnings Correlation Summary
| Measurement | Canadian | Menominee |
| Minimum | $19,688 | $22,480 |
| Maximum | $80,682 | $44,793 |
| Range | $60,994 | $22,313 |
| Mean | $44,712 | $33,658 |
| Median | $44,948 | $34,813 |
| Interquartile 25% (IQ1) | $37,642 | $29,201 |
| Interquartile 75% (IQ3) | $51,935 | $37,722 |
| Interquartile Range (IQR) | $14,293 | $8,521 |
| Standard Deviation (Sample) | $12,220 | $5,845 |
| Standard Deviation (Population) | $12,058 | $5,722 |
Similar Demographics by Median Earnings
Demographics Similar to Canadians by Median Earnings
In terms of median earnings, the demographic groups most similar to Canadians are European ($47,915, a difference of 0.010%), Taiwanese ($47,902, a difference of 0.020%), Immigrants from Nepal ($47,925, a difference of 0.030%), Immigrants from Sierra Leone ($47,875, a difference of 0.080%), and Ugandan ($47,854, a difference of 0.12%).
| Demographics | Rating | Rank | Median Earnings |
| British | 92.2 /100 | #132 | Exceptional $48,189 |
| Immigrants | Uganda | 90.5 /100 | #133 | Exceptional $48,041 |
| Sri Lankans | 90.5 /100 | #134 | Exceptional $48,040 |
| Portuguese | 90.4 /100 | #135 | Exceptional $48,032 |
| Slovenes | 90.0 /100 | #136 | Excellent $47,995 |
| Immigrants | Nepal | 89.0 /100 | #137 | Excellent $47,925 |
| Europeans | 88.9 /100 | #138 | Excellent $47,915 |
| Canadians | 88.8 /100 | #139 | Excellent $47,911 |
| Taiwanese | 88.7 /100 | #140 | Excellent $47,902 |
| Immigrants | Sierra Leone | 88.3 /100 | #141 | Excellent $47,875 |
| Ugandans | 88.0 /100 | #142 | Excellent $47,854 |
| Swedes | 88.0 /100 | #143 | Excellent $47,851 |
| Hungarians | 87.1 /100 | #144 | Excellent $47,795 |
| Immigrants | Saudi Arabia | 85.6 /100 | #145 | Excellent $47,704 |
| Immigrants | Chile | 85.5 /100 | #146 | Excellent $47,697 |
Demographics Similar to Menominee by Median Earnings
In terms of median earnings, the demographic groups most similar to Menominee are Pima ($38,285, a difference of 1.1%), Immigrants from Cuba ($38,426, a difference of 1.4%), Crow ($38,707, a difference of 2.2%), Navajo ($36,999, a difference of 2.4%), and Native/Alaskan ($38,896, a difference of 2.7%).
| Demographics | Rating | Rank | Median Earnings |
| Yakama | 0.0 /100 | #332 | Tragic $39,107 |
| Houma | 0.0 /100 | #333 | Tragic $38,949 |
| Spanish American Indians | 0.0 /100 | #334 | Tragic $38,907 |
| Natives/Alaskans | 0.0 /100 | #335 | Tragic $38,896 |
| Crow | 0.0 /100 | #336 | Tragic $38,707 |
| Immigrants | Cuba | 0.0 /100 | #337 | Tragic $38,426 |
| Pima | 0.0 /100 | #338 | Tragic $38,285 |
| Menominee | 0.0 /100 | #339 | Tragic $37,884 |
| Navajo | 0.0 /100 | #340 | Tragic $36,999 |
| Lumbee | 0.0 /100 | #341 | Tragic $36,876 |
| Hopi | 0.0 /100 | #342 | Tragic $36,871 |
| Pueblo | 0.0 /100 | #343 | Tragic $36,859 |
| Arapaho | 0.0 /100 | #344 | Tragic $36,586 |
| Tohono O'odham | 0.0 /100 | #345 | Tragic $36,349 |
| Yup'ik | 0.0 /100 | #346 | Tragic $35,942 |