Immigrants from Barbados vs Menominee College, 1 year or more
COMPARE
Immigrants from Barbados
Menominee
College, 1 year or more
College, 1 year or more Comparison
Immigrants from Barbados
Menominee
55.4%
COLLEGE, 1 YEAR OR MORE
0.6/ 100
METRIC RATING
253rd/ 347
METRIC RANK
50.6%
COLLEGE, 1 YEAR OR MORE
0.0/ 100
METRIC RATING
327th/ 347
METRIC RANK
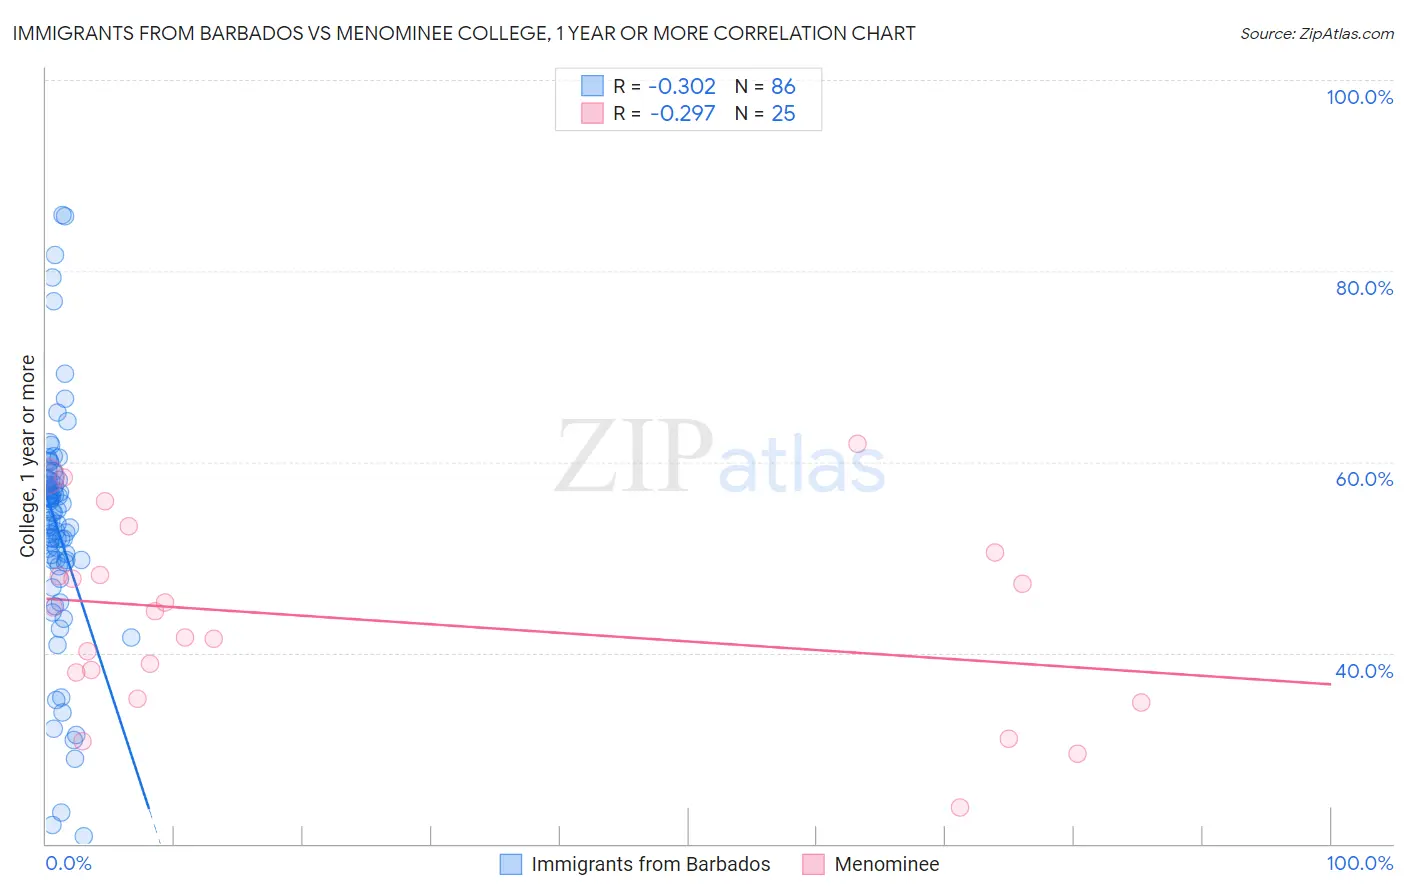
Immigrants from Barbados vs Menominee College, 1 year or more Correlation Chart
The statistical analysis conducted on geographies consisting of 112,783,541 people shows a mild negative correlation between the proportion of Immigrants from Barbados and percentage of population with at least college, 1 year or more education in the United States with a correlation coefficient (R) of -0.302 and weighted average of 55.4%. Similarly, the statistical analysis conducted on geographies consisting of 45,778,860 people shows a weak negative correlation between the proportion of Menominee and percentage of population with at least college, 1 year or more education in the United States with a correlation coefficient (R) of -0.297 and weighted average of 50.6%, a difference of 9.5%.
College, 1 year or more Correlation Summary
| Measurement | Immigrants from Barbados | Menominee |
| Minimum | 20.7% | 23.8% |
| Maximum | 85.8% | 61.9% |
| Range | 65.1% | 38.1% |
| Mean | 53.0% | 43.5% |
| Median | 53.8% | 44.3% |
| Interquartile 25% (IQ1) | 49.7% | 36.6% |
| Interquartile 75% (IQ3) | 58.1% | 49.3% |
| Interquartile Range (IQR) | 8.4% | 12.7% |
| Standard Deviation (Sample) | 12.1% | 9.8% |
| Standard Deviation (Population) | 12.1% | 9.6% |
Similar Demographics by College, 1 year or more
Demographics Similar to Immigrants from Barbados by College, 1 year or more
In terms of college, 1 year or more, the demographic groups most similar to Immigrants from Barbados are Aleut (55.4%, a difference of 0.11%), Immigrants from Cambodia (55.4%, a difference of 0.13%), Delaware (55.5%, a difference of 0.23%), Immigrants from Trinidad and Tobago (55.5%, a difference of 0.25%), and Japanese (55.2%, a difference of 0.25%).
| Demographics | Rating | Rank | College, 1 year or more |
| Malaysians | 0.8 /100 | #246 | Tragic 55.6% |
| Hawaiians | 0.8 /100 | #247 | Tragic 55.6% |
| Immigrants | Congo | 0.8 /100 | #248 | Tragic 55.6% |
| Immigrants | Trinidad and Tobago | 0.7 /100 | #249 | Tragic 55.5% |
| Delaware | 0.7 /100 | #250 | Tragic 55.5% |
| Immigrants | Cambodia | 0.6 /100 | #251 | Tragic 55.4% |
| Aleuts | 0.6 /100 | #252 | Tragic 55.4% |
| Immigrants | Barbados | 0.6 /100 | #253 | Tragic 55.4% |
| Japanese | 0.5 /100 | #254 | Tragic 55.2% |
| Immigrants | Bahamas | 0.5 /100 | #255 | Tragic 55.2% |
| Immigrants | West Indies | 0.5 /100 | #256 | Tragic 55.2% |
| Indonesians | 0.4 /100 | #257 | Tragic 55.1% |
| Africans | 0.4 /100 | #258 | Tragic 55.0% |
| Nepalese | 0.3 /100 | #259 | Tragic 54.9% |
| Jamaicans | 0.3 /100 | #260 | Tragic 54.9% |
Demographics Similar to Menominee by College, 1 year or more
In terms of college, 1 year or more, the demographic groups most similar to Menominee are Dominican (50.6%, a difference of 0.040%), Dutch West Indian (50.5%, a difference of 0.12%), Immigrants from Latin America (50.7%, a difference of 0.22%), Immigrants from Cuba (50.7%, a difference of 0.25%), and Immigrants from Guatemala (50.7%, a difference of 0.26%).
| Demographics | Rating | Rank | College, 1 year or more |
| Kiowa | 0.0 /100 | #320 | Tragic 51.0% |
| Hopi | 0.0 /100 | #321 | Tragic 50.9% |
| Navajo | 0.0 /100 | #322 | Tragic 50.8% |
| Immigrants | Guatemala | 0.0 /100 | #323 | Tragic 50.7% |
| Immigrants | Cuba | 0.0 /100 | #324 | Tragic 50.7% |
| Immigrants | Latin America | 0.0 /100 | #325 | Tragic 50.7% |
| Dominicans | 0.0 /100 | #326 | Tragic 50.6% |
| Menominee | 0.0 /100 | #327 | Tragic 50.6% |
| Dutch West Indians | 0.0 /100 | #328 | Tragic 50.5% |
| Cape Verdeans | 0.0 /100 | #329 | Tragic 50.3% |
| Natives/Alaskans | 0.0 /100 | #330 | Tragic 50.2% |
| Immigrants | Yemen | 0.0 /100 | #331 | Tragic 50.0% |
| Mexicans | 0.0 /100 | #332 | Tragic 49.2% |
| Immigrants | Dominican Republic | 0.0 /100 | #333 | Tragic 49.1% |
| Lumbee | 0.0 /100 | #334 | Tragic 48.9% |