Immigrants from Burma/Myanmar vs Menominee College, 1 year or more
COMPARE
Immigrants from Burma/Myanmar
Menominee
College, 1 year or more
College, 1 year or more Comparison
Immigrants from Burma/Myanmar
Menominee
56.6%
COLLEGE, 1 YEAR OR MORE
2.7/ 100
METRIC RATING
231st/ 347
METRIC RANK
50.6%
COLLEGE, 1 YEAR OR MORE
0.0/ 100
METRIC RATING
327th/ 347
METRIC RANK
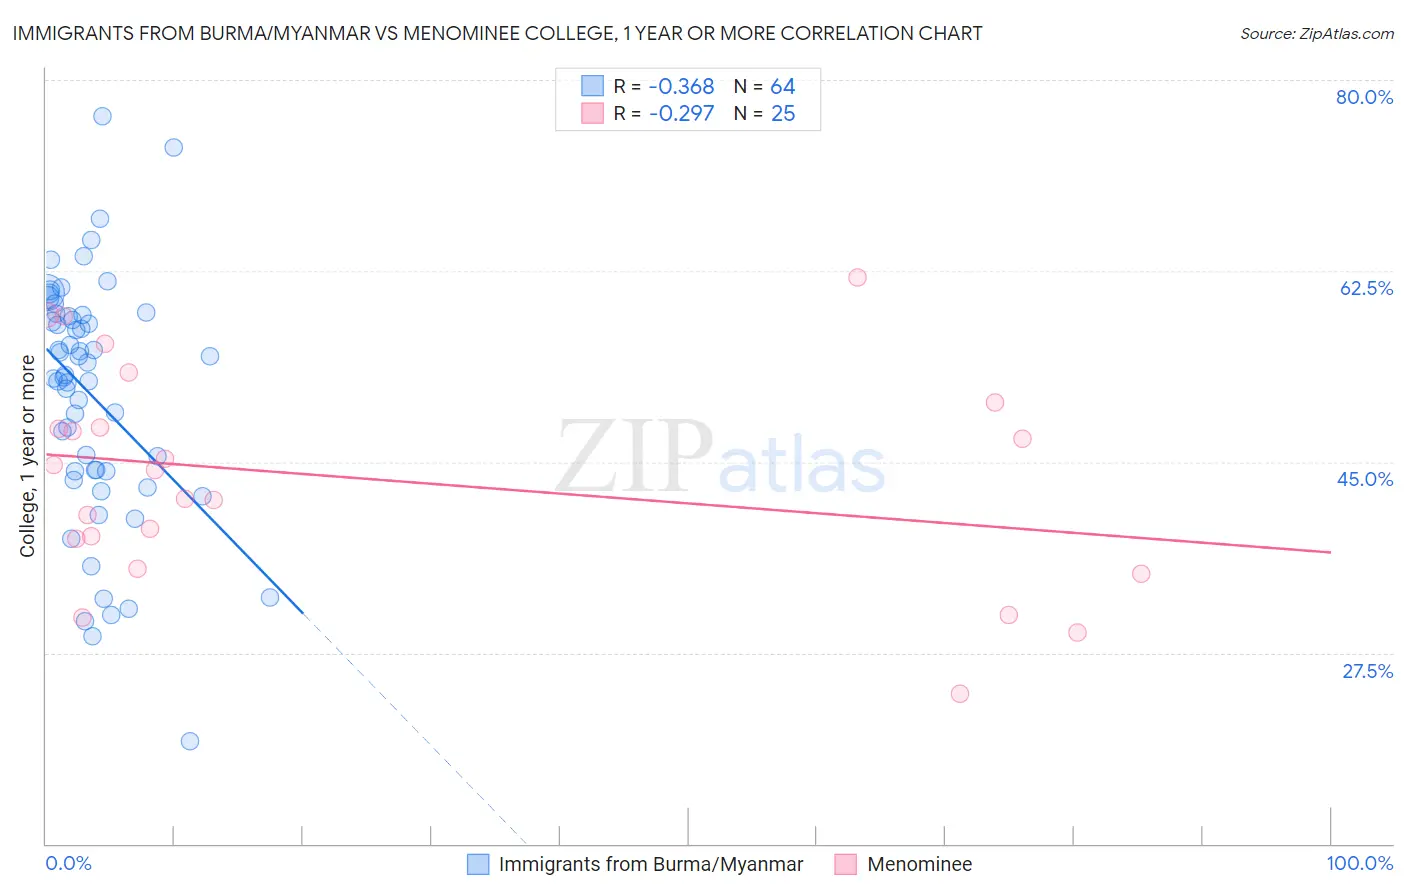
Immigrants from Burma/Myanmar vs Menominee College, 1 year or more Correlation Chart
The statistical analysis conducted on geographies consisting of 172,357,706 people shows a mild negative correlation between the proportion of Immigrants from Burma/Myanmar and percentage of population with at least college, 1 year or more education in the United States with a correlation coefficient (R) of -0.368 and weighted average of 56.6%. Similarly, the statistical analysis conducted on geographies consisting of 45,778,860 people shows a weak negative correlation between the proportion of Menominee and percentage of population with at least college, 1 year or more education in the United States with a correlation coefficient (R) of -0.297 and weighted average of 50.6%, a difference of 11.9%.
College, 1 year or more Correlation Summary
| Measurement | Immigrants from Burma/Myanmar | Menominee |
| Minimum | 19.4% | 23.8% |
| Maximum | 76.7% | 61.9% |
| Range | 57.3% | 38.1% |
| Mean | 51.0% | 43.5% |
| Median | 52.9% | 44.3% |
| Interquartile 25% (IQ1) | 44.1% | 36.6% |
| Interquartile 75% (IQ3) | 58.4% | 49.3% |
| Interquartile Range (IQR) | 14.3% | 12.7% |
| Standard Deviation (Sample) | 11.1% | 9.8% |
| Standard Deviation (Population) | 11.1% | 9.6% |
Similar Demographics by College, 1 year or more
Demographics Similar to Immigrants from Burma/Myanmar by College, 1 year or more
In terms of college, 1 year or more, the demographic groups most similar to Immigrants from Burma/Myanmar are Immigrants from Bangladesh (56.6%, a difference of 0.060%), Nonimmigrants (56.5%, a difference of 0.15%), Liberian (56.7%, a difference of 0.19%), Cree (56.8%, a difference of 0.41%), and Immigrants from Fiji (56.9%, a difference of 0.54%).
| Demographics | Rating | Rank | College, 1 year or more |
| Hmong | 5.4 /100 | #224 | Tragic 57.2% |
| Vietnamese | 4.7 /100 | #225 | Tragic 57.0% |
| Immigrants | Western Africa | 4.6 /100 | #226 | Tragic 57.0% |
| Immigrants | Immigrants | 4.4 /100 | #227 | Tragic 57.0% |
| Immigrants | Fiji | 4.0 /100 | #228 | Tragic 56.9% |
| Cree | 3.6 /100 | #229 | Tragic 56.8% |
| Liberians | 3.1 /100 | #230 | Tragic 56.7% |
| Immigrants | Burma/Myanmar | 2.7 /100 | #231 | Tragic 56.6% |
| Immigrants | Bangladesh | 2.6 /100 | #232 | Tragic 56.6% |
| Immigrants | Nonimmigrants | 2.5 /100 | #233 | Tragic 56.5% |
| Spanish Americans | 1.8 /100 | #234 | Tragic 56.3% |
| West Indians | 1.8 /100 | #235 | Tragic 56.3% |
| Iroquois | 1.7 /100 | #236 | Tragic 56.2% |
| Samoans | 1.6 /100 | #237 | Tragic 56.2% |
| Barbadians | 1.3 /100 | #238 | Tragic 56.0% |
Demographics Similar to Menominee by College, 1 year or more
In terms of college, 1 year or more, the demographic groups most similar to Menominee are Dominican (50.6%, a difference of 0.040%), Dutch West Indian (50.5%, a difference of 0.12%), Immigrants from Latin America (50.7%, a difference of 0.22%), Immigrants from Cuba (50.7%, a difference of 0.25%), and Immigrants from Guatemala (50.7%, a difference of 0.26%).
| Demographics | Rating | Rank | College, 1 year or more |
| Kiowa | 0.0 /100 | #320 | Tragic 51.0% |
| Hopi | 0.0 /100 | #321 | Tragic 50.9% |
| Navajo | 0.0 /100 | #322 | Tragic 50.8% |
| Immigrants | Guatemala | 0.0 /100 | #323 | Tragic 50.7% |
| Immigrants | Cuba | 0.0 /100 | #324 | Tragic 50.7% |
| Immigrants | Latin America | 0.0 /100 | #325 | Tragic 50.7% |
| Dominicans | 0.0 /100 | #326 | Tragic 50.6% |
| Menominee | 0.0 /100 | #327 | Tragic 50.6% |
| Dutch West Indians | 0.0 /100 | #328 | Tragic 50.5% |
| Cape Verdeans | 0.0 /100 | #329 | Tragic 50.3% |
| Natives/Alaskans | 0.0 /100 | #330 | Tragic 50.2% |
| Immigrants | Yemen | 0.0 /100 | #331 | Tragic 50.0% |
| Mexicans | 0.0 /100 | #332 | Tragic 49.2% |
| Immigrants | Dominican Republic | 0.0 /100 | #333 | Tragic 49.1% |
| Lumbee | 0.0 /100 | #334 | Tragic 48.9% |