Cambodian vs Immigrants from the Azores Bachelor's Degree
COMPARE
Cambodian
Immigrants from the Azores
Bachelor's Degree
Bachelor's Degree Comparison
Cambodians
Immigrants from the Azores
47.2%
BACHELOR'S DEGREE
100.0/ 100
METRIC RATING
19th/ 347
METRIC RANK
27.3%
BACHELOR'S DEGREE
0.0/ 100
METRIC RATING
331st/ 347
METRIC RANK
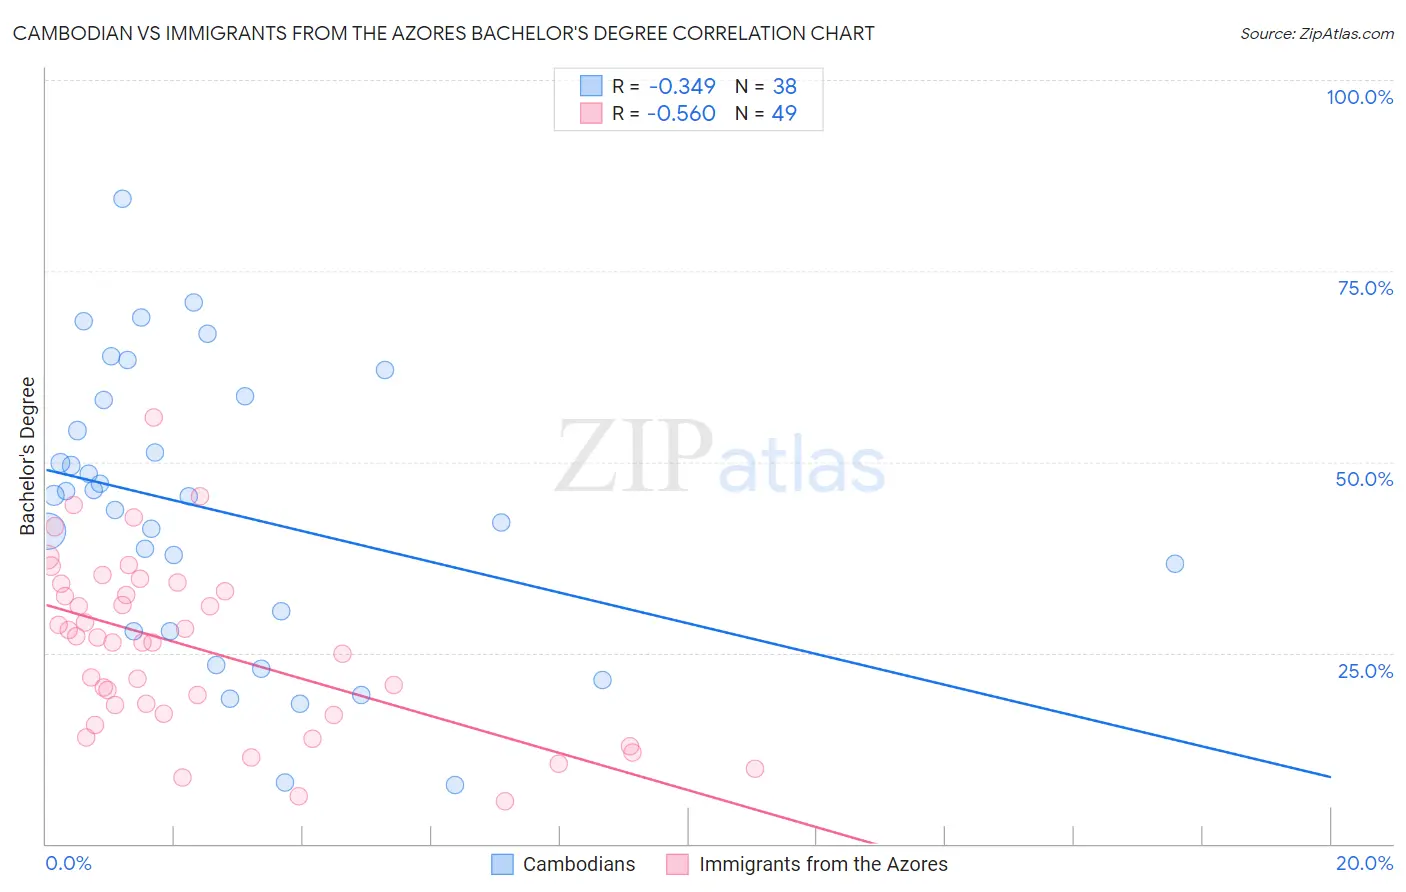
Cambodian vs Immigrants from the Azores Bachelor's Degree Correlation Chart
The statistical analysis conducted on geographies consisting of 102,512,775 people shows a mild negative correlation between the proportion of Cambodians and percentage of population with at least bachelor's degree education in the United States with a correlation coefficient (R) of -0.349 and weighted average of 47.2%. Similarly, the statistical analysis conducted on geographies consisting of 46,257,310 people shows a substantial negative correlation between the proportion of Immigrants from the Azores and percentage of population with at least bachelor's degree education in the United States with a correlation coefficient (R) of -0.560 and weighted average of 27.3%, a difference of 72.9%.
Bachelor's Degree Correlation Summary
| Measurement | Cambodian | Immigrants from the Azores |
| Minimum | 7.6% | 5.6% |
| Maximum | 84.4% | 55.9% |
| Range | 76.8% | 50.3% |
| Mean | 43.6% | 25.6% |
| Median | 45.6% | 26.4% |
| Interquartile 25% (IQ1) | 27.8% | 16.9% |
| Interquartile 75% (IQ3) | 58.1% | 33.6% |
| Interquartile Range (IQR) | 30.3% | 16.6% |
| Standard Deviation (Sample) | 18.4% | 11.2% |
| Standard Deviation (Population) | 18.2% | 11.1% |
Similar Demographics by Bachelor's Degree
Demographics Similar to Cambodians by Bachelor's Degree
In terms of bachelor's degree, the demographic groups most similar to Cambodians are Immigrants from Switzerland (47.1%, a difference of 0.22%), Immigrants from Ireland (47.1%, a difference of 0.23%), Indian (Asian) (47.4%, a difference of 0.43%), Immigrants from Belgium (47.0%, a difference of 0.43%), and Immigrants from Sweden (47.0%, a difference of 0.52%).
| Demographics | Rating | Rank | Bachelor's Degree |
| Immigrants | China | 100.0 /100 | #12 | Exceptional 48.4% |
| Immigrants | South Central Asia | 100.0 /100 | #13 | Exceptional 48.3% |
| Immigrants | Hong Kong | 100.0 /100 | #14 | Exceptional 48.2% |
| Immigrants | Eastern Asia | 100.0 /100 | #15 | Exceptional 48.1% |
| Soviet Union | 100.0 /100 | #16 | Exceptional 47.9% |
| Eastern Europeans | 100.0 /100 | #17 | Exceptional 47.5% |
| Indians (Asian) | 100.0 /100 | #18 | Exceptional 47.4% |
| Cambodians | 100.0 /100 | #19 | Exceptional 47.2% |
| Immigrants | Switzerland | 100.0 /100 | #20 | Exceptional 47.1% |
| Immigrants | Ireland | 100.0 /100 | #21 | Exceptional 47.1% |
| Immigrants | Belgium | 100.0 /100 | #22 | Exceptional 47.0% |
| Immigrants | Sweden | 100.0 /100 | #23 | Exceptional 47.0% |
| Immigrants | Korea | 100.0 /100 | #24 | Exceptional 47.0% |
| Burmese | 100.0 /100 | #25 | Exceptional 46.9% |
| Immigrants | Japan | 100.0 /100 | #26 | Exceptional 46.8% |
Demographics Similar to Immigrants from the Azores by Bachelor's Degree
In terms of bachelor's degree, the demographic groups most similar to Immigrants from the Azores are Menominee (27.3%, a difference of 0.10%), Spanish American Indian (27.5%, a difference of 0.48%), Immigrants from Central America (27.5%, a difference of 0.54%), Mexican (27.1%, a difference of 0.92%), and Crow (27.7%, a difference of 1.5%).
| Demographics | Rating | Rank | Bachelor's Degree |
| Dutch West Indians | 0.0 /100 | #324 | Tragic 28.5% |
| Pennsylvania Germans | 0.0 /100 | #325 | Tragic 28.4% |
| Apache | 0.0 /100 | #326 | Tragic 28.3% |
| Paiute | 0.0 /100 | #327 | Tragic 28.1% |
| Crow | 0.0 /100 | #328 | Tragic 27.7% |
| Immigrants | Central America | 0.0 /100 | #329 | Tragic 27.5% |
| Spanish American Indians | 0.0 /100 | #330 | Tragic 27.5% |
| Immigrants | Azores | 0.0 /100 | #331 | Tragic 27.3% |
| Menominee | 0.0 /100 | #332 | Tragic 27.3% |
| Mexicans | 0.0 /100 | #333 | Tragic 27.1% |
| Arapaho | 0.0 /100 | #334 | Tragic 26.6% |
| Natives/Alaskans | 0.0 /100 | #335 | Tragic 26.3% |
| Immigrants | Mexico | 0.0 /100 | #336 | Tragic 26.1% |
| Inupiat | 0.0 /100 | #337 | Tragic 25.8% |
| Pueblo | 0.0 /100 | #338 | Tragic 25.5% |