Cambodian vs Bhutanese Bachelor's Degree

COMPARE

Cambodian
Race
Ancestry
AfghanAfricanAlaska NativeAlaskan AthabascanAlbanianAleutAlsatianAmericanApacheArabArapahoArgentineanArmenianAssyrian/Chaldean/SyriacAustralianAustrianBahamianBangladeshiBarbadianBasqueBelgianBelizeanBermudanBlackfeetBolivianBrazilianBritishBritish West IndianBulgarianBurmeseCajunCambodianCanadianCape VerdeanCarpatho RusynCelticCentral AmericanCentral American IndianCherokeeCheyenneChickasawChileanChineseChippewaChoctawColombianColvilleComancheCosta RicanCreeCreekCroatianCrowCubanCypriotCzechCzechoslovakianDanishDelawareDominicanDutchDutch West IndianEastern EuropeanEcuadorianEgyptianEnglishEstonianEthiopianEuropeanFijianFilipinoFinnishFrenchFrench American IndianFrench CanadianGermanGerman RussianGhanaianGreekGuamanian/ChamorroGuatemalanGuyaneseHaitianHmongHonduranHopiHoumaHungarianIcelanderIndian (Asian)IndonesianInupiatIranianIraqiIrishIroquoisIsraeliItalianJamaicanJapaneseJordanianKenyanKiowaKoreanLaotianLatvianLebaneseLiberianLithuanianLumbeeLuxembourgerMacedonianMalaysianMalteseMarshalleseMenomineeMexicanMexican American IndianMongolianMoroccanNative HawaiianNavajoNepaleseNew ZealanderNicaraguanNigerianNorthern EuropeanNorwegianOkinawanOsageOttawaPaiutePakistaniPalestinianPanamanianParaguayanPennsylvania GermanPeruvianPimaPolishPortuguesePotawatomiPuebloPuerto RicanPuget Sound SalishRomanianRussianSalvadoranSamoanScandinavianScotch-IrishScottishSeminoleSenegaleseSerbianShoshoneSierra LeoneanSiouxSlavicSlovakSloveneSomaliSouth AfricanSouth AmericanSouth American IndianSoviet UnionSpaniardSpanishSpanish AmericanSpanish American IndianSri LankanSubsaharan AfricanSudaneseSwedishSwissSyrianTaiwaneseThaiTlingit-HaidaTohono O'OdhamTonganTrinidadian and TobagonianTsimshianTurkishU.S. Virgin IslanderUgandanUkrainianUruguayanUteVenezuelanVietnameseWelshWest IndianYakamaYaquiYugoslavianYumanYup'ikZimbabwean
Immigration
NonimmigrantsImmigrantsAfghanistanAfricaAlbaniaArgentinaArmeniaAsiaAustraliaAustriaBahamasBangladeshBarbadosBelarusBelgiumBelizeBoliviaBosnia and HerzegovinaBrazilBulgariaBurma/MyanmarCabo VerdeCambodiaCameroonCanadaCaribbeanCentral AmericaChileChinaColombiaCongoCosta RicaCroatiaCubaCzechoslovakiaDenmarkDominicaDominican RepublicEastern AfricaEastern AsiaEastern EuropeEcuadorEgyptEl SalvadorEnglandEritreaEthiopiaEuropeFijiFranceGermanyGhanaGreeceGrenadaGuatemalaGuyanaHaitiHondurasHong KongHungaryIndiaIndonesiaIranIraqIrelandIsraelItalyJamaicaJapanJordanKazakhstanKenyaKoreaKuwaitLaosLatin AmericaLatviaLebanonLiberiaLithuaniaMalaysiaMexicoMicronesiaMiddle AfricaMoldovaMoroccoNepalNetherlandsNicaraguaNigeriaNorth AmericaNorth MacedoniaNorthern AfricaNorthern EuropeNorwayOceaniaPakistanPanamaPeruPhilippinesPolandPortugalRomaniaRussiaSaudi ArabiaScotlandSenegalSerbiaSierra LeoneSingaporeSomaliaSouth AfricaSouth AmericaSouth Central AsiaSouth Eastern AsiaSouthern EuropeSpainSri LankaSt. Vincent and the GrenadinesSudanSwedenSwitzerlandSyriaTaiwanThailandTrinidad and TobagoTurkeyUgandaUkraineUruguayUzbekistanVenezuelaVietnamWest IndiesWestern AfricaWestern AsiaWestern EuropeYemenZaireZimbabweAzores
Bhutanese
Race
Ancestry
AfghanAfricanAlaska NativeAlaskan AthabascanAlbanianAleutAlsatianAmericanApacheArabArapahoArgentineanArmenianAssyrian/Chaldean/SyriacAustralianAustrianBahamianBangladeshiBarbadianBasqueBelgianBelizeanBermudanBhutaneseBlackfeetBolivianBrazilianBritishBritish West IndianBulgarianBurmeseCajunCanadianCape VerdeanCarpatho RusynCelticCentral AmericanCentral American IndianCherokeeCheyenneChickasawChileanChineseChippewaChoctawColombianColvilleComancheCosta RicanCreeCreekCroatianCrowCubanCypriotCzechCzechoslovakianDanishDelawareDominicanDutchDutch West IndianEastern EuropeanEcuadorianEgyptianEnglishEstonianEthiopianEuropeanFijianFilipinoFinnishFrenchFrench American IndianFrench CanadianGermanGerman RussianGhanaianGreekGuamanian/ChamorroGuatemalanGuyaneseHaitianHmongHonduranHopiHoumaHungarianIcelanderIndian (Asian)IndonesianInupiatIranianIraqiIrishIroquoisIsraeliItalianJamaicanJapaneseJordanianKenyanKiowaKoreanLaotianLatvianLebaneseLiberianLithuanianLumbeeLuxembourgerMacedonianMalaysianMalteseMarshalleseMenomineeMexicanMexican American IndianMongolianMoroccanNative HawaiianNavajoNepaleseNew ZealanderNicaraguanNigerianNorthern EuropeanNorwegianOkinawanOsageOttawaPaiutePakistaniPalestinianPanamanianParaguayanPennsylvania GermanPeruvianPimaPolishPortuguesePotawatomiPuebloPuerto RicanPuget Sound SalishRomanianRussianSalvadoranSamoanScandinavianScotch-IrishScottishSeminoleSenegaleseSerbianShoshoneSierra LeoneanSiouxSlavicSlovakSloveneSomaliSouth AfricanSouth AmericanSouth American IndianSoviet UnionSpaniardSpanishSpanish AmericanSpanish American IndianSri LankanSubsaharan AfricanSudaneseSwedishSwissSyrianTaiwaneseThaiTlingit-HaidaTohono O'OdhamTonganTrinidadian and TobagonianTsimshianTurkishU.S. Virgin IslanderUgandanUkrainianUruguayanUteVenezuelanVietnameseWelshWest IndianYakamaYaquiYugoslavianYumanYup'ikZimbabwean
Immigration
NonimmigrantsImmigrantsAfghanistanAfricaAlbaniaArgentinaArmeniaAsiaAustraliaAustriaBahamasBangladeshBarbadosBelarusBelgiumBelizeBoliviaBosnia and HerzegovinaBrazilBulgariaBurma/MyanmarCabo VerdeCambodiaCameroonCanadaCaribbeanCentral AmericaChileChinaColombiaCongoCosta RicaCroatiaCubaCzechoslovakiaDenmarkDominicaDominican RepublicEastern AfricaEastern AsiaEastern EuropeEcuadorEgyptEl SalvadorEnglandEritreaEthiopiaEuropeFijiFranceGermanyGhanaGreeceGrenadaGuatemalaGuyanaHaitiHondurasHong KongHungaryIndiaIndonesiaIranIraqIrelandIsraelItalyJamaicaJapanJordanKazakhstanKenyaKoreaKuwaitLaosLatin AmericaLatviaLebanonLiberiaLithuaniaMalaysiaMexicoMicronesiaMiddle AfricaMoldovaMoroccoNepalNetherlandsNicaraguaNigeriaNorth AmericaNorth MacedoniaNorthern AfricaNorthern EuropeNorwayOceaniaPakistanPanamaPeruPhilippinesPolandPortugalRomaniaRussiaSaudi ArabiaScotlandSenegalSerbiaSierra LeoneSingaporeSomaliaSouth AfricaSouth AmericaSouth Central AsiaSouth Eastern AsiaSouthern EuropeSpainSri LankaSt. Vincent and the GrenadinesSudanSwedenSwitzerlandSyriaTaiwanThailandTrinidad and TobagoTurkeyUgandaUkraineUruguayUzbekistanVenezuelaVietnamWest IndiesWestern AfricaWestern AsiaWestern EuropeYemenZaireZimbabweAzores
Bachelor's Degree
Income
Poverty
Unemployment
Labor Participation
Family Structure
Vehicle Availability
Education Level
Disability

Bachelor's Degree Comparison

Cambodians

Bhutanese

Exceptional
Exceptional
47.2%
BACHELOR'S DEGREE
100.0/ 100
METRIC RATING
19th/ 347
METRIC RANK
42.7%
BACHELOR'S DEGREE
99.5/ 100
METRIC RATING
74th/ 347
METRIC RANK

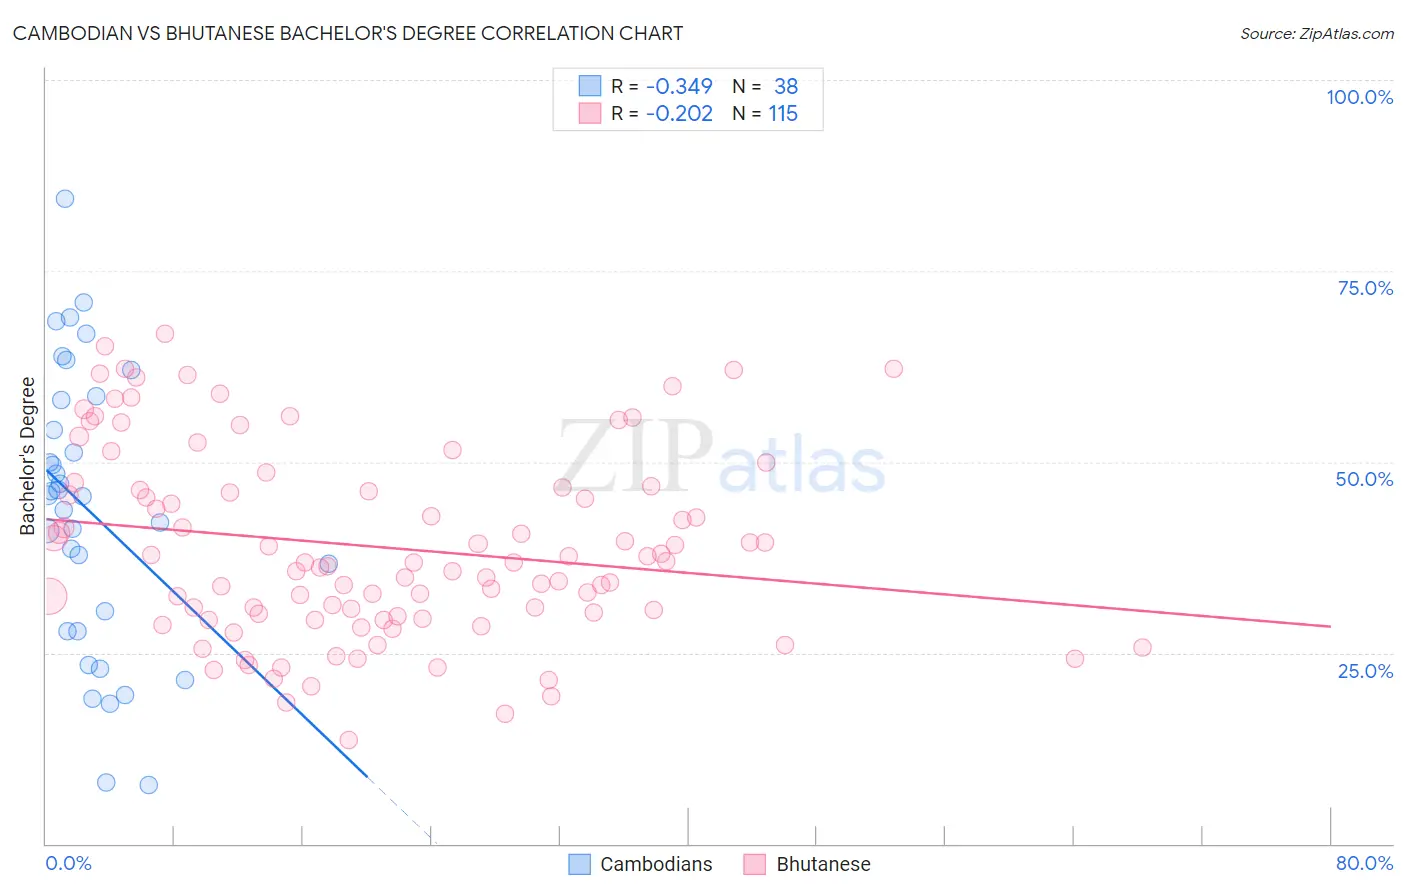
Cambodian vs Bhutanese Bachelor's Degree Correlation Chart

The statistical analysis conducted on geographies consisting of 102,512,775 people shows a mild negative correlation between the proportion of Cambodians and percentage of population with at least bachelor's degree education in the United States with a correlation coefficient (R) of -0.349 and weighted average of 47.2%. Similarly, the statistical analysis conducted on geographies consisting of 455,522,940 people shows a weak negative correlation between the proportion of Bhutanese and percentage of population with at least bachelor's degree education in the United States with a correlation coefficient (R) of -0.202 and weighted average of 42.7%, a difference of 10.7%.
Cambodian vs Bhutanese Bachelor's Degree

Bachelor's Degree Correlation Summary

MeasurementCambodianBhutanese
Minimum7.6%13.6%
Maximum84.4%66.7%
Range76.8%53.1%
Mean43.6%38.8%
Median45.6%36.9%
Interquartile 25% (IQ1)27.8%29.8%
Interquartile 75% (IQ3)58.1%46.7%
Interquartile Range (IQR)30.3%16.9%
Standard Deviation (Sample)18.4%12.4%
Standard Deviation (Population)18.2%12.3%

Similar Demographics by Bachelor's Degree

Demographics Similar to Cambodians by Bachelor's Degree

In terms of bachelor's degree, the demographic groups most similar to Cambodians are Immigrants from Switzerland (47.1%, a difference of 0.22%), Immigrants from Ireland (47.1%, a difference of 0.23%), Indian (Asian) (47.4%, a difference of 0.43%), Immigrants from Belgium (47.0%, a difference of 0.43%), and Immigrants from Sweden (47.0%, a difference of 0.52%).
DemographicsRating | RankBachelor's Degree
Immigrants | China
100.0
/100
|
#12
Exceptional
48.4%
Immigrants | South Central Asia
100.0
/100
|
#13
Exceptional
48.3%
Immigrants | Hong Kong
100.0
/100
|
#14
Exceptional
48.2%
Immigrants | Eastern Asia
100.0
/100
|
#15
Exceptional
48.1%
Soviet Union
100.0
/100
|
#16
Exceptional
47.9%
Eastern Europeans
100.0
/100
|
#17
Exceptional
47.5%
Indians (Asian)
100.0
/100
|
#18
Exceptional
47.4%
Cambodians
100.0
/100
|
#19
Exceptional
47.2%
Immigrants | Switzerland
100.0
/100
|
#20
Exceptional
47.1%
Immigrants | Ireland
100.0
/100
|
#21
Exceptional
47.1%
Immigrants | Belgium
100.0
/100
|
#22
Exceptional
47.0%
Immigrants | Sweden
100.0
/100
|
#23
Exceptional
47.0%
Immigrants | Korea
100.0
/100
|
#24
Exceptional
47.0%
Burmese
100.0
/100
|
#25
Exceptional
46.9%
Immigrants | Japan
100.0
/100
|
#26
Exceptional
46.8%

Demographics Similar to Bhutanese by Bachelor's Degree

In terms of bachelor's degree, the demographic groups most similar to Bhutanese are Immigrants from Zimbabwe (42.6%, a difference of 0.21%), Immigrants from Uzbekistan (42.8%, a difference of 0.22%), Immigrants from Egypt (42.6%, a difference of 0.23%), Ethiopian (42.8%, a difference of 0.27%), and Immigrants from Argentina (42.8%, a difference of 0.36%).
DemographicsRating | RankBachelor's Degree
Egyptians
99.7
/100
|
#67
Exceptional
43.3%
Immigrants | Indonesia
99.7
/100
|
#68
Exceptional
43.3%
Immigrants | Pakistan
99.7
/100
|
#69
Exceptional
43.1%
Immigrants | Romania
99.6
/100
|
#70
Exceptional
42.9%
Immigrants | Argentina
99.6
/100
|
#71
Exceptional
42.8%
Ethiopians
99.5
/100
|
#72
Exceptional
42.8%
Immigrants | Uzbekistan
99.5
/100
|
#73
Exceptional
42.8%
Bhutanese
99.5
/100
|
#74
Exceptional
42.7%
Immigrants | Zimbabwe
99.4
/100
|
#75
Exceptional
42.6%
Immigrants | Egypt
99.4
/100
|
#76
Exceptional
42.6%
Immigrants | Eastern Europe
99.4
/100
|
#77
Exceptional
42.5%
Immigrants | Ethiopia
99.4
/100
|
#78
Exceptional
42.5%
Immigrants | Lebanon
99.3
/100
|
#79
Exceptional
42.4%
Immigrants | Croatia
99.2
/100
|
#80
Exceptional
42.3%
Immigrants | Hungary
99.2
/100
|
#81
Exceptional
42.3%