Cambodian vs Comanche In Labor Force | Age 16-19
COMPARE
Cambodian
Comanche
In Labor Force | Age 16-19
In Labor Force | Age 16-19 Comparison
Cambodians
Comanche
37.0%
IN LABOR FORCE | AGE 16-19
71.5/ 100
METRIC RATING
161st/ 347
METRIC RANK
37.7%
IN LABOR FORCE | AGE 16-19
91.9/ 100
METRIC RATING
138th/ 347
METRIC RANK
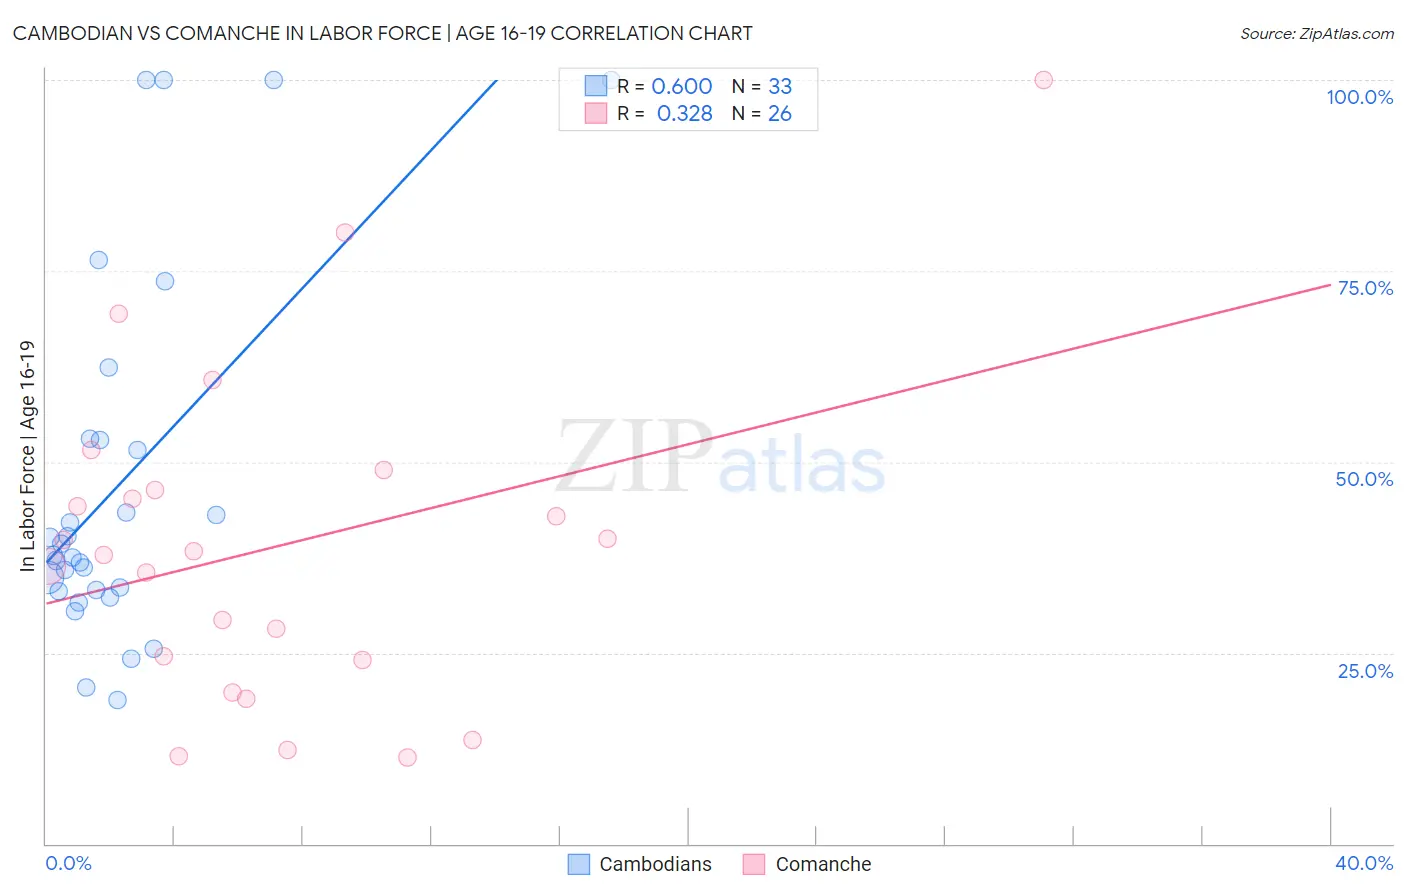
Cambodian vs Comanche In Labor Force | Age 16-19 Correlation Chart
The statistical analysis conducted on geographies consisting of 102,494,767 people shows a significant positive correlation between the proportion of Cambodians and labor force participation rate among population between the ages 16 and 19 in the United States with a correlation coefficient (R) of 0.600 and weighted average of 37.0%. Similarly, the statistical analysis conducted on geographies consisting of 109,736,088 people shows a mild positive correlation between the proportion of Comanche and labor force participation rate among population between the ages 16 and 19 in the United States with a correlation coefficient (R) of 0.328 and weighted average of 37.7%, a difference of 1.9%.
In Labor Force | Age 16-19 Correlation Summary
| Measurement | Cambodian | Comanche |
| Minimum | 18.8% | 11.3% |
| Maximum | 100.0% | 100.0% |
| Range | 81.2% | 88.7% |
| Mean | 47.2% | 38.8% |
| Median | 37.7% | 38.0% |
| Interquartile 25% (IQ1) | 33.2% | 24.0% |
| Interquartile 75% (IQ3) | 53.0% | 46.3% |
| Interquartile Range (IQR) | 19.8% | 22.3% |
| Standard Deviation (Sample) | 23.6% | 21.5% |
| Standard Deviation (Population) | 23.3% | 21.1% |
Similar Demographics by In Labor Force | Age 16-19
Demographics Similar to Cambodians by In Labor Force | Age 16-19
In terms of in labor force | age 16-19, the demographic groups most similar to Cambodians are Immigrants from Jordan (36.9%, a difference of 0.12%), Bermudan (36.9%, a difference of 0.13%), Immigrants from Saudi Arabia (37.0%, a difference of 0.15%), Immigrants from Kuwait (36.9%, a difference of 0.16%), and Yaqui (37.1%, a difference of 0.18%).
| Demographics | Rating | Rank | In Labor Force | Age 16-19 |
| Immigrants | Bulgaria | 81.6 /100 | #154 | Excellent 37.3% |
| Immigrants | Lithuania | 80.7 /100 | #155 | Excellent 37.2% |
| Kiowa | 80.4 /100 | #156 | Excellent 37.2% |
| Immigrants | Brazil | 76.5 /100 | #157 | Good 37.1% |
| Ute | 75.7 /100 | #158 | Good 37.1% |
| Yaqui | 74.4 /100 | #159 | Good 37.1% |
| Immigrants | Saudi Arabia | 73.9 /100 | #160 | Good 37.0% |
| Cambodians | 71.5 /100 | #161 | Good 37.0% |
| Immigrants | Jordan | 69.5 /100 | #162 | Good 36.9% |
| Bermudans | 69.3 /100 | #163 | Good 36.9% |
| Immigrants | Kuwait | 68.9 /100 | #164 | Good 36.9% |
| Yakama | 66.9 /100 | #165 | Good 36.9% |
| Immigrants | Western Africa | 66.7 /100 | #166 | Good 36.9% |
| Arabs | 63.6 /100 | #167 | Good 36.8% |
| Palestinians | 63.1 /100 | #168 | Good 36.8% |
Demographics Similar to Comanche by In Labor Force | Age 16-19
In terms of in labor force | age 16-19, the demographic groups most similar to Comanche are Immigrants from Moldova (37.7%, a difference of 0.010%), Estonian (37.7%, a difference of 0.050%), Syrian (37.6%, a difference of 0.19%), Australian (37.8%, a difference of 0.23%), and Cajun (37.8%, a difference of 0.23%).
| Demographics | Rating | Rank | In Labor Force | Age 16-19 |
| Immigrants | Austria | 95.0 /100 | #131 | Exceptional 37.9% |
| Immigrants | Oceania | 94.7 /100 | #132 | Exceptional 37.9% |
| Cheyenne | 94.6 /100 | #133 | Exceptional 37.9% |
| Immigrants | Netherlands | 93.7 /100 | #134 | Exceptional 37.8% |
| Macedonians | 93.4 /100 | #135 | Exceptional 37.8% |
| Australians | 93.2 /100 | #136 | Exceptional 37.8% |
| Cajuns | 93.2 /100 | #137 | Exceptional 37.8% |
| Comanche | 91.9 /100 | #138 | Exceptional 37.7% |
| Immigrants | Moldova | 91.9 /100 | #139 | Exceptional 37.7% |
| Estonians | 91.7 /100 | #140 | Exceptional 37.7% |
| Syrians | 90.7 /100 | #141 | Exceptional 37.6% |
| Sierra Leoneans | 89.7 /100 | #142 | Excellent 37.6% |
| Pakistanis | 89.5 /100 | #143 | Excellent 37.6% |
| Japanese | 89.3 /100 | #144 | Excellent 37.5% |
| Paiute | 89.3 /100 | #145 | Excellent 37.5% |