Cambodian vs British Bachelor's Degree
COMPARE
Cambodian
British
Bachelor's Degree
Bachelor's Degree Comparison
Cambodians
British
47.2%
BACHELOR'S DEGREE
100.0/ 100
METRIC RATING
19th/ 347
METRIC RANK
40.4%
BACHELOR'S DEGREE
94.2/ 100
METRIC RATING
125th/ 347
METRIC RANK
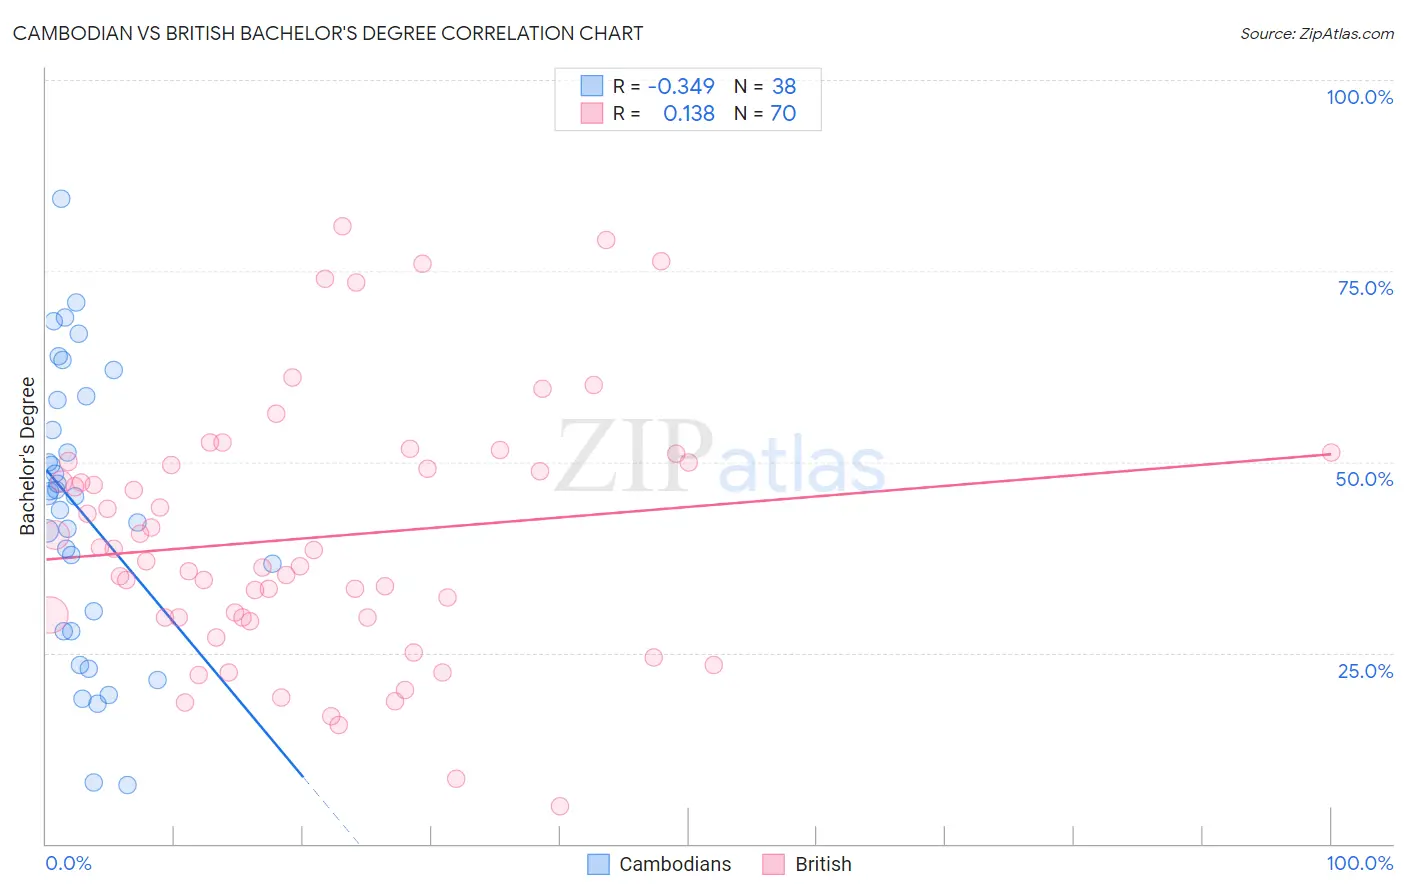
Cambodian vs British Bachelor's Degree Correlation Chart
The statistical analysis conducted on geographies consisting of 102,512,775 people shows a mild negative correlation between the proportion of Cambodians and percentage of population with at least bachelor's degree education in the United States with a correlation coefficient (R) of -0.349 and weighted average of 47.2%. Similarly, the statistical analysis conducted on geographies consisting of 531,374,091 people shows a poor positive correlation between the proportion of British and percentage of population with at least bachelor's degree education in the United States with a correlation coefficient (R) of 0.138 and weighted average of 40.4%, a difference of 17.0%.
Bachelor's Degree Correlation Summary
| Measurement | Cambodian | British |
| Minimum | 7.6% | 5.0% |
| Maximum | 84.4% | 80.9% |
| Range | 76.8% | 76.0% |
| Mean | 43.6% | 40.1% |
| Median | 45.6% | 37.7% |
| Interquartile 25% (IQ1) | 27.8% | 29.6% |
| Interquartile 75% (IQ3) | 58.1% | 50.0% |
| Interquartile Range (IQR) | 30.3% | 20.4% |
| Standard Deviation (Sample) | 18.4% | 16.7% |
| Standard Deviation (Population) | 18.2% | 16.6% |
Similar Demographics by Bachelor's Degree
Demographics Similar to Cambodians by Bachelor's Degree
In terms of bachelor's degree, the demographic groups most similar to Cambodians are Immigrants from Switzerland (47.1%, a difference of 0.22%), Immigrants from Ireland (47.1%, a difference of 0.23%), Indian (Asian) (47.4%, a difference of 0.43%), Immigrants from Belgium (47.0%, a difference of 0.43%), and Immigrants from Sweden (47.0%, a difference of 0.52%).
| Demographics | Rating | Rank | Bachelor's Degree |
| Immigrants | China | 100.0 /100 | #12 | Exceptional 48.4% |
| Immigrants | South Central Asia | 100.0 /100 | #13 | Exceptional 48.3% |
| Immigrants | Hong Kong | 100.0 /100 | #14 | Exceptional 48.2% |
| Immigrants | Eastern Asia | 100.0 /100 | #15 | Exceptional 48.1% |
| Soviet Union | 100.0 /100 | #16 | Exceptional 47.9% |
| Eastern Europeans | 100.0 /100 | #17 | Exceptional 47.5% |
| Indians (Asian) | 100.0 /100 | #18 | Exceptional 47.4% |
| Cambodians | 100.0 /100 | #19 | Exceptional 47.2% |
| Immigrants | Switzerland | 100.0 /100 | #20 | Exceptional 47.1% |
| Immigrants | Ireland | 100.0 /100 | #21 | Exceptional 47.1% |
| Immigrants | Belgium | 100.0 /100 | #22 | Exceptional 47.0% |
| Immigrants | Sweden | 100.0 /100 | #23 | Exceptional 47.0% |
| Immigrants | Korea | 100.0 /100 | #24 | Exceptional 47.0% |
| Burmese | 100.0 /100 | #25 | Exceptional 46.9% |
| Immigrants | Japan | 100.0 /100 | #26 | Exceptional 46.8% |
Demographics Similar to British by Bachelor's Degree
In terms of bachelor's degree, the demographic groups most similar to British are Immigrants from Eritrea (40.4%, a difference of 0.030%), Lebanese (40.4%, a difference of 0.040%), Immigrants from Eastern Africa (40.4%, a difference of 0.050%), Immigrants from Albania (40.4%, a difference of 0.060%), and Moroccan (40.5%, a difference of 0.16%).
| Demographics | Rating | Rank | Bachelor's Degree |
| Croatians | 95.5 /100 | #118 | Exceptional 40.6% |
| Immigrants | Syria | 94.9 /100 | #119 | Exceptional 40.5% |
| Venezuelans | 94.7 /100 | #120 | Exceptional 40.5% |
| Moroccans | 94.6 /100 | #121 | Exceptional 40.5% |
| Immigrants | Albania | 94.4 /100 | #122 | Exceptional 40.4% |
| Lebanese | 94.3 /100 | #123 | Exceptional 40.4% |
| Immigrants | Eritrea | 94.3 /100 | #124 | Exceptional 40.4% |
| British | 94.2 /100 | #125 | Exceptional 40.4% |
| Immigrants | Eastern Africa | 94.1 /100 | #126 | Exceptional 40.4% |
| Immigrants | Jordan | 93.4 /100 | #127 | Exceptional 40.3% |
| Immigrants | Venezuela | 92.9 /100 | #128 | Exceptional 40.2% |
| Serbians | 92.4 /100 | #129 | Exceptional 40.1% |
| Sierra Leoneans | 92.2 /100 | #130 | Exceptional 40.1% |
| Italians | 91.9 /100 | #131 | Exceptional 40.1% |
| Taiwanese | 91.1 /100 | #132 | Exceptional 40.0% |