Black/African American vs Comanche 12th Grade, No Diploma
COMPARE
Black/African American
Comanche
12th Grade, No Diploma
12th Grade, No Diploma Comparison
Blacks/African Americans
Comanche
89.3%
12TH GRADE, NO DIPLOMA
0.1/ 100
METRIC RATING
271st/ 347
METRIC RANK
89.9%
12TH GRADE, NO DIPLOMA
1.1/ 100
METRIC RATING
248th/ 347
METRIC RANK
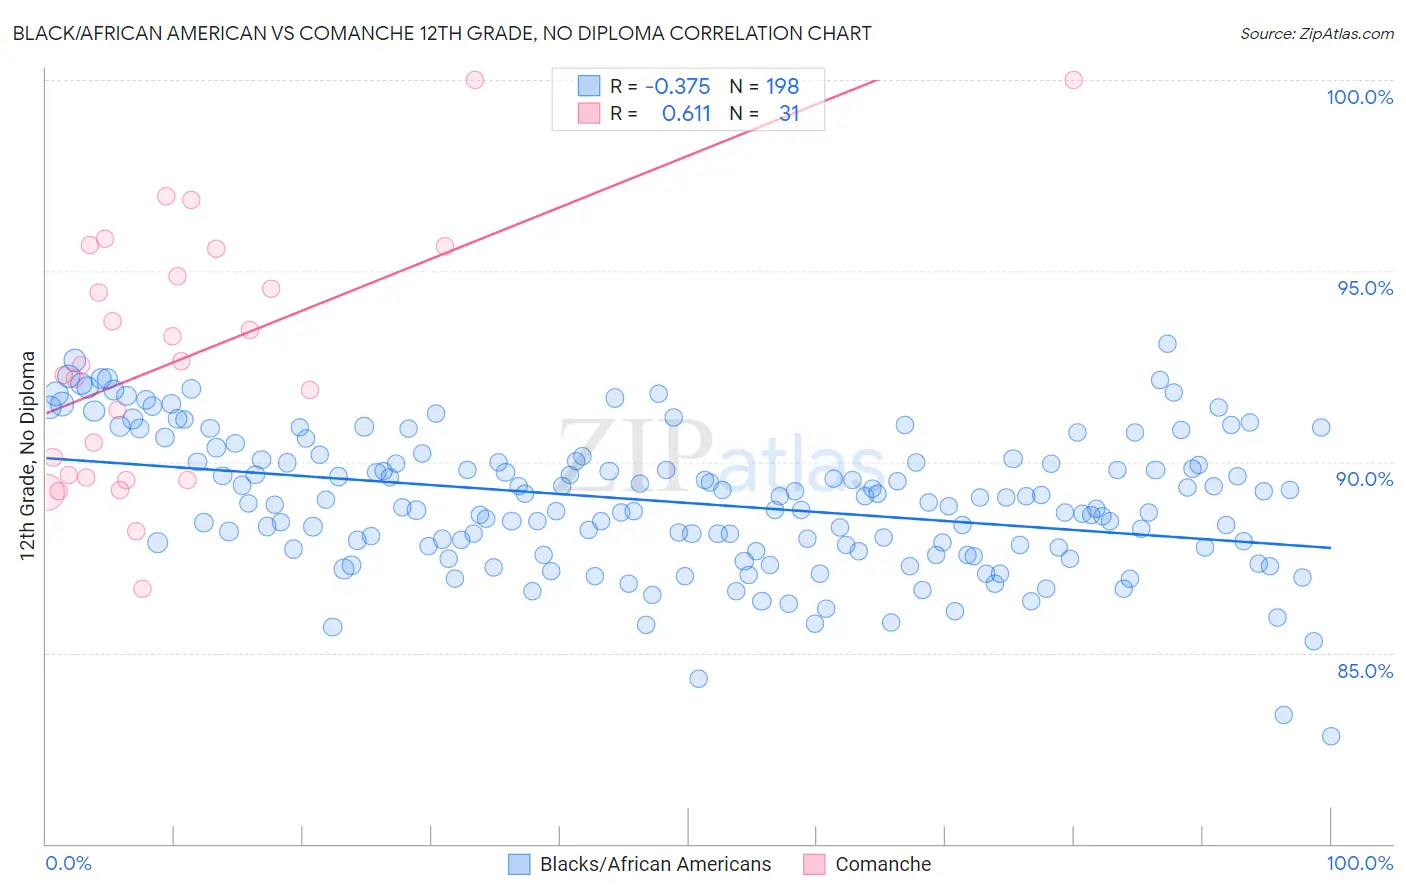
Black/African American vs Comanche 12th Grade, No Diploma Correlation Chart
The statistical analysis conducted on geographies consisting of 566,032,166 people shows a mild negative correlation between the proportion of Blacks/African Americans and percentage of population with at least 12th grade (no diploma) education in the United States with a correlation coefficient (R) of -0.375 and weighted average of 89.3%. Similarly, the statistical analysis conducted on geographies consisting of 109,786,530 people shows a significant positive correlation between the proportion of Comanche and percentage of population with at least 12th grade (no diploma) education in the United States with a correlation coefficient (R) of 0.611 and weighted average of 89.9%, a difference of 0.72%.
12th Grade, No Diploma Correlation Summary
| Measurement | Black/African American | Comanche |
| Minimum | 82.8% | 86.7% |
| Maximum | 93.1% | 100.0% |
| Range | 10.3% | 13.3% |
| Mean | 88.9% | 92.7% |
| Median | 88.9% | 92.5% |
| Interquartile 25% (IQ1) | 87.7% | 89.6% |
| Interquartile 75% (IQ3) | 90.0% | 95.6% |
| Interquartile Range (IQR) | 2.3% | 6.0% |
| Standard Deviation (Sample) | 1.8% | 3.4% |
| Standard Deviation (Population) | 1.8% | 3.3% |
Similar Demographics by 12th Grade, No Diploma
Demographics Similar to Blacks/African Americans by 12th Grade, No Diploma
In terms of 12th grade, no diploma, the demographic groups most similar to Blacks/African Americans are Bangladeshi (89.3%, a difference of 0.0%), Malaysian (89.2%, a difference of 0.010%), U.S. Virgin Islander (89.3%, a difference of 0.050%), Immigrants from Trinidad and Tobago (89.3%, a difference of 0.080%), and West Indian (89.3%, a difference of 0.10%).
| Demographics | Rating | Rank | 12th Grade, No Diploma |
| Sri Lankans | 0.2 /100 | #264 | Tragic 89.4% |
| Trinidadians and Tobagonians | 0.2 /100 | #265 | Tragic 89.4% |
| Seminole | 0.2 /100 | #266 | Tragic 89.4% |
| West Indians | 0.2 /100 | #267 | Tragic 89.3% |
| Immigrants | Trinidad and Tobago | 0.1 /100 | #268 | Tragic 89.3% |
| U.S. Virgin Islanders | 0.1 /100 | #269 | Tragic 89.3% |
| Bangladeshis | 0.1 /100 | #270 | Tragic 89.3% |
| Blacks/African Americans | 0.1 /100 | #271 | Tragic 89.3% |
| Malaysians | 0.1 /100 | #272 | Tragic 89.2% |
| Barbadians | 0.1 /100 | #273 | Tragic 89.1% |
| Cajuns | 0.1 /100 | #274 | Tragic 89.1% |
| Immigrants | Congo | 0.1 /100 | #275 | Tragic 89.0% |
| Ute | 0.1 /100 | #276 | Tragic 89.0% |
| Immigrants | Barbados | 0.0 /100 | #277 | Tragic 89.0% |
| Immigrants | St. Vincent and the Grenadines | 0.0 /100 | #278 | Tragic 88.9% |
Demographics Similar to Comanche by 12th Grade, No Diploma
In terms of 12th grade, no diploma, the demographic groups most similar to Comanche are Senegalese (89.9%, a difference of 0.0%), Immigrants from Eritrea (89.9%, a difference of 0.030%), Spanish American (89.9%, a difference of 0.040%), Immigrants from Nigeria (89.9%, a difference of 0.050%), and Bahamian (89.9%, a difference of 0.050%).
| Demographics | Rating | Rank | 12th Grade, No Diploma |
| Immigrants | Middle Africa | 1.7 /100 | #241 | Tragic 90.0% |
| Immigrants | Costa Rica | 1.6 /100 | #242 | Tragic 90.0% |
| Crow | 1.5 /100 | #243 | Tragic 90.0% |
| Taiwanese | 1.5 /100 | #244 | Tragic 90.0% |
| Immigrants | Uruguay | 1.4 /100 | #245 | Tragic 90.0% |
| Ghanaians | 1.3 /100 | #246 | Tragic 90.0% |
| Immigrants | Nigeria | 1.3 /100 | #247 | Tragic 89.9% |
| Comanche | 1.1 /100 | #248 | Tragic 89.9% |
| Senegalese | 1.1 /100 | #249 | Tragic 89.9% |
| Immigrants | Eritrea | 1.0 /100 | #250 | Tragic 89.9% |
| Spanish Americans | 0.9 /100 | #251 | Tragic 89.9% |
| Bahamians | 0.9 /100 | #252 | Tragic 89.9% |
| Choctaw | 0.7 /100 | #253 | Tragic 89.8% |
| Immigrants | Peru | 0.5 /100 | #254 | Tragic 89.7% |
| Immigrants | Senegal | 0.5 /100 | #255 | Tragic 89.7% |