Black/African American vs Immigrants from Scotland 12th Grade, No Diploma
COMPARE
Black/African American
Immigrants from Scotland
12th Grade, No Diploma
12th Grade, No Diploma Comparison
Blacks/African Americans
Immigrants from Scotland
89.3%
12TH GRADE, NO DIPLOMA
0.1/ 100
METRIC RATING
271st/ 347
METRIC RANK
93.0%
12TH GRADE, NO DIPLOMA
99.9/ 100
METRIC RATING
33rd/ 347
METRIC RANK
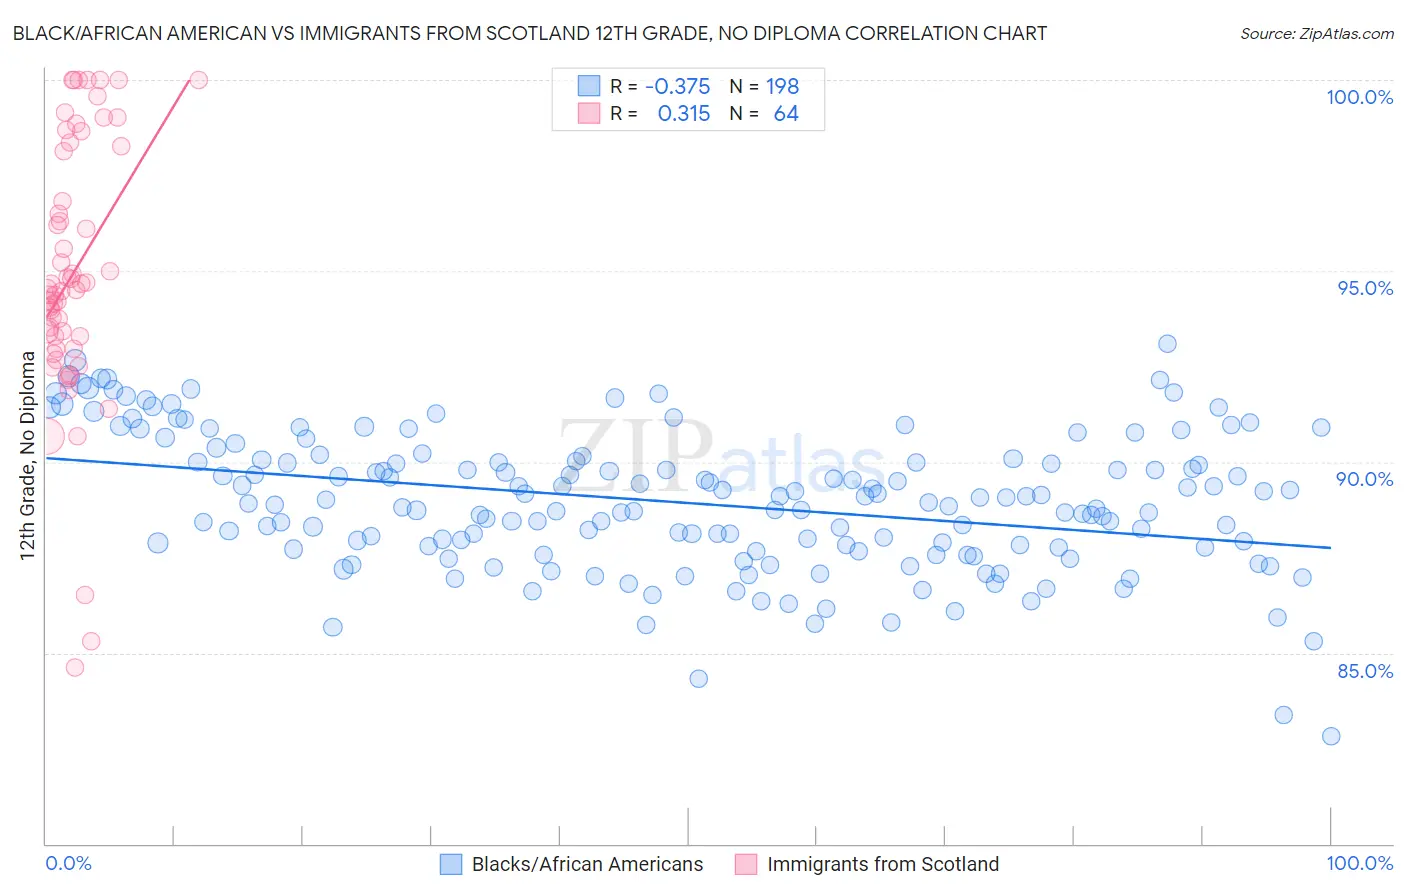
Black/African American vs Immigrants from Scotland 12th Grade, No Diploma Correlation Chart
The statistical analysis conducted on geographies consisting of 566,032,166 people shows a mild negative correlation between the proportion of Blacks/African Americans and percentage of population with at least 12th grade (no diploma) education in the United States with a correlation coefficient (R) of -0.375 and weighted average of 89.3%. Similarly, the statistical analysis conducted on geographies consisting of 196,398,887 people shows a mild positive correlation between the proportion of Immigrants from Scotland and percentage of population with at least 12th grade (no diploma) education in the United States with a correlation coefficient (R) of 0.315 and weighted average of 93.0%, a difference of 4.2%.
12th Grade, No Diploma Correlation Summary
| Measurement | Black/African American | Immigrants from Scotland |
| Minimum | 82.8% | 84.6% |
| Maximum | 93.1% | 100.0% |
| Range | 10.3% | 15.4% |
| Mean | 88.9% | 94.9% |
| Median | 88.9% | 94.5% |
| Interquartile 25% (IQ1) | 87.7% | 93.1% |
| Interquartile 75% (IQ3) | 90.0% | 98.2% |
| Interquartile Range (IQR) | 2.3% | 5.1% |
| Standard Deviation (Sample) | 1.8% | 3.4% |
| Standard Deviation (Population) | 1.8% | 3.4% |
Similar Demographics by 12th Grade, No Diploma
Demographics Similar to Blacks/African Americans by 12th Grade, No Diploma
In terms of 12th grade, no diploma, the demographic groups most similar to Blacks/African Americans are Bangladeshi (89.3%, a difference of 0.0%), Malaysian (89.2%, a difference of 0.010%), U.S. Virgin Islander (89.3%, a difference of 0.050%), Immigrants from Trinidad and Tobago (89.3%, a difference of 0.080%), and West Indian (89.3%, a difference of 0.10%).
| Demographics | Rating | Rank | 12th Grade, No Diploma |
| Sri Lankans | 0.2 /100 | #264 | Tragic 89.4% |
| Trinidadians and Tobagonians | 0.2 /100 | #265 | Tragic 89.4% |
| Seminole | 0.2 /100 | #266 | Tragic 89.4% |
| West Indians | 0.2 /100 | #267 | Tragic 89.3% |
| Immigrants | Trinidad and Tobago | 0.1 /100 | #268 | Tragic 89.3% |
| U.S. Virgin Islanders | 0.1 /100 | #269 | Tragic 89.3% |
| Bangladeshis | 0.1 /100 | #270 | Tragic 89.3% |
| Blacks/African Americans | 0.1 /100 | #271 | Tragic 89.3% |
| Malaysians | 0.1 /100 | #272 | Tragic 89.2% |
| Barbadians | 0.1 /100 | #273 | Tragic 89.1% |
| Cajuns | 0.1 /100 | #274 | Tragic 89.1% |
| Immigrants | Congo | 0.1 /100 | #275 | Tragic 89.0% |
| Ute | 0.1 /100 | #276 | Tragic 89.0% |
| Immigrants | Barbados | 0.0 /100 | #277 | Tragic 89.0% |
| Immigrants | St. Vincent and the Grenadines | 0.0 /100 | #278 | Tragic 88.9% |
Demographics Similar to Immigrants from Scotland by 12th Grade, No Diploma
In terms of 12th grade, no diploma, the demographic groups most similar to Immigrants from Scotland are Okinawan (93.0%, a difference of 0.020%), European (93.1%, a difference of 0.030%), English (93.0%, a difference of 0.030%), Scottish (93.0%, a difference of 0.030%), and Irish (93.0%, a difference of 0.030%).
| Demographics | Rating | Rank | 12th Grade, No Diploma |
| Russians | 99.9 /100 | #26 | Exceptional 93.2% |
| Cypriots | 99.9 /100 | #27 | Exceptional 93.1% |
| Immigrants | Northern Europe | 99.9 /100 | #28 | Exceptional 93.1% |
| Iranians | 99.9 /100 | #29 | Exceptional 93.1% |
| Immigrants | Lithuania | 99.9 /100 | #30 | Exceptional 93.1% |
| Immigrants | Ireland | 99.9 /100 | #31 | Exceptional 93.1% |
| Europeans | 99.9 /100 | #32 | Exceptional 93.1% |
| Immigrants | Scotland | 99.9 /100 | #33 | Exceptional 93.0% |
| Okinawans | 99.9 /100 | #34 | Exceptional 93.0% |
| English | 99.9 /100 | #35 | Exceptional 93.0% |
| Scottish | 99.9 /100 | #36 | Exceptional 93.0% |
| Irish | 99.9 /100 | #37 | Exceptional 93.0% |
| Tlingit-Haida | 99.8 /100 | #38 | Exceptional 93.0% |
| Immigrants | Austria | 99.8 /100 | #39 | Exceptional 93.0% |
| Turks | 99.8 /100 | #40 | Exceptional 93.0% |