Black/African American vs Immigrants from Ecuador Nursery School
COMPARE
Black/African American
Immigrants from Ecuador
Nursery School
Nursery School Comparison
Blacks/African Americans
Immigrants from Ecuador
97.9%
NURSERY SCHOOL
29.4/ 100
METRIC RATING
192nd/ 347
METRIC RANK
96.9%
NURSERY SCHOOL
0.0/ 100
METRIC RATING
317th/ 347
METRIC RANK
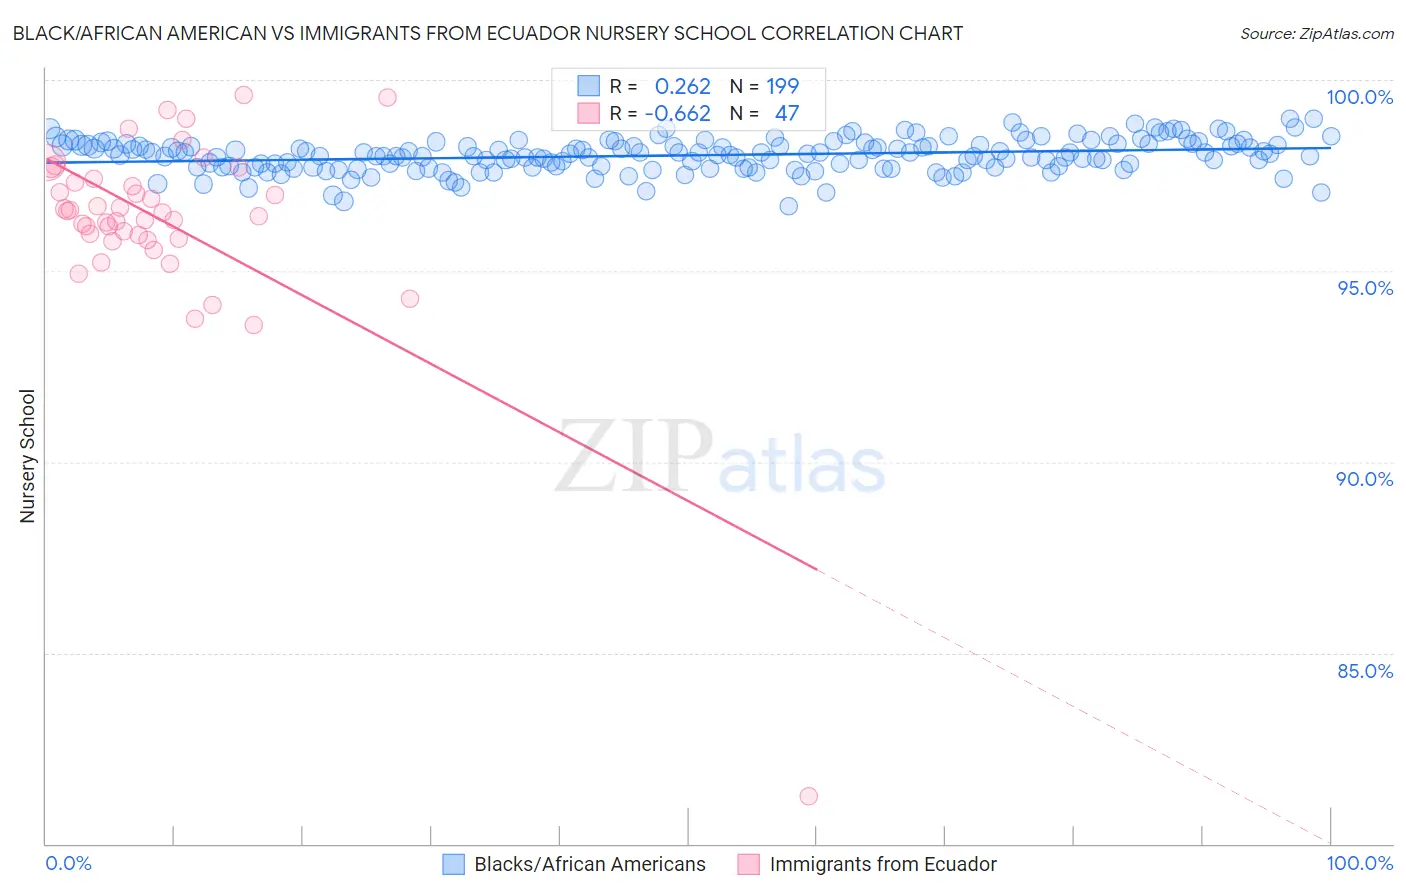
Black/African American vs Immigrants from Ecuador Nursery School Correlation Chart
The statistical analysis conducted on geographies consisting of 566,043,750 people shows a weak positive correlation between the proportion of Blacks/African Americans and percentage of population with at least nursery school education in the United States with a correlation coefficient (R) of 0.262 and weighted average of 97.9%. Similarly, the statistical analysis conducted on geographies consisting of 271,020,679 people shows a significant negative correlation between the proportion of Immigrants from Ecuador and percentage of population with at least nursery school education in the United States with a correlation coefficient (R) of -0.662 and weighted average of 96.9%, a difference of 1.0%.
Nursery School Correlation Summary
| Measurement | Black/African American | Immigrants from Ecuador |
| Minimum | 96.7% | 81.2% |
| Maximum | 99.0% | 99.6% |
| Range | 2.3% | 18.3% |
| Mean | 98.0% | 96.3% |
| Median | 98.0% | 96.5% |
| Interquartile 25% (IQ1) | 97.7% | 95.8% |
| Interquartile 75% (IQ3) | 98.3% | 97.4% |
| Interquartile Range (IQR) | 0.60% | 1.6% |
| Standard Deviation (Sample) | 0.42% | 2.6% |
| Standard Deviation (Population) | 0.42% | 2.6% |
Similar Demographics by Nursery School
Demographics Similar to Blacks/African Americans by Nursery School
In terms of nursery school, the demographic groups most similar to Blacks/African Americans are Immigrants from Taiwan (97.9%, a difference of 0.0%), Paraguayan (97.9%, a difference of 0.010%), Mongolian (97.9%, a difference of 0.010%), Hawaiian (97.9%, a difference of 0.010%), and Guamanian/Chamorro (97.9%, a difference of 0.010%).
| Demographics | Rating | Rank | Nursery School |
| Immigrants | Belarus | 41.0 /100 | #185 | Average 98.0% |
| Immigrants | Argentina | 40.8 /100 | #186 | Average 98.0% |
| Immigrants | Kazakhstan | 37.1 /100 | #187 | Fair 97.9% |
| Arabs | 34.7 /100 | #188 | Fair 97.9% |
| Pakistanis | 34.6 /100 | #189 | Fair 97.9% |
| Panamanians | 34.3 /100 | #190 | Fair 97.9% |
| Immigrants | Taiwan | 30.6 /100 | #191 | Fair 97.9% |
| Blacks/African Americans | 29.4 /100 | #192 | Fair 97.9% |
| Paraguayans | 27.4 /100 | #193 | Fair 97.9% |
| Mongolians | 27.3 /100 | #194 | Fair 97.9% |
| Hawaiians | 27.2 /100 | #195 | Fair 97.9% |
| Guamanians/Chamorros | 25.7 /100 | #196 | Fair 97.9% |
| Yuman | 25.7 /100 | #197 | Fair 97.9% |
| Immigrants | Kenya | 24.1 /100 | #198 | Fair 97.9% |
| Immigrants | Egypt | 22.5 /100 | #199 | Fair 97.9% |
Demographics Similar to Immigrants from Ecuador by Nursery School
In terms of nursery school, the demographic groups most similar to Immigrants from Ecuador are Cape Verdean (97.0%, a difference of 0.010%), Immigrants from Nicaragua (96.9%, a difference of 0.010%), Immigrants from Belize (96.9%, a difference of 0.010%), Honduran (97.0%, a difference of 0.020%), and Immigrants from Guyana (96.9%, a difference of 0.040%).
| Demographics | Rating | Rank | Nursery School |
| Guyanese | 0.0 /100 | #310 | Tragic 97.0% |
| Immigrants | Azores | 0.0 /100 | #311 | Tragic 97.0% |
| Sri Lankans | 0.0 /100 | #312 | Tragic 97.0% |
| Hondurans | 0.0 /100 | #313 | Tragic 97.0% |
| Cape Verdeans | 0.0 /100 | #314 | Tragic 97.0% |
| Immigrants | Nicaragua | 0.0 /100 | #315 | Tragic 96.9% |
| Immigrants | Belize | 0.0 /100 | #316 | Tragic 96.9% |
| Immigrants | Ecuador | 0.0 /100 | #317 | Tragic 96.9% |
| Immigrants | Guyana | 0.0 /100 | #318 | Tragic 96.9% |
| Immigrants | Laos | 0.0 /100 | #319 | Tragic 96.9% |
| Immigrants | Burma/Myanmar | 0.0 /100 | #320 | Tragic 96.9% |
| Immigrants | Bangladesh | 0.0 /100 | #321 | Tragic 96.9% |
| Mexican American Indians | 0.0 /100 | #322 | Tragic 96.9% |
| Immigrants | Honduras | 0.0 /100 | #323 | Tragic 96.9% |
| Vietnamese | 0.0 /100 | #324 | Tragic 96.8% |